CDMSlite Run 2 period 1 LIPs Search
CDMSlite Run 2 period 1 LIPs Search
Abstract This Public Documentation accompanies the results of the search for Lightly Ionizing Particles (LIPs) using CDMSlite Run 2 period 1 data. The analysis is looking for LIPs of mass 5 MeV/c2 to 100 TeV/c2, charge e/100 to e/108, and βγ 0.1 to 106. Geant4 simulation is used to create the probability distribution functions (PDFs) for LIPs of different charges, mass and βγ. The analysis efficiencies will be the same as the CDMSlite WIMP search with two additional correction factors to account for an additional source of inefficiency in singles and radial cuts. These factors arise due to the fact that unlike WIMPs, LIPs are capable of multiple detector interactions as well as multiple interactions within same detector. These correction factors are calculated using data from Geant4 simulation. The analysis is exploring new LIPs parameter space.
These results can be found at arxiv "2011.09183".
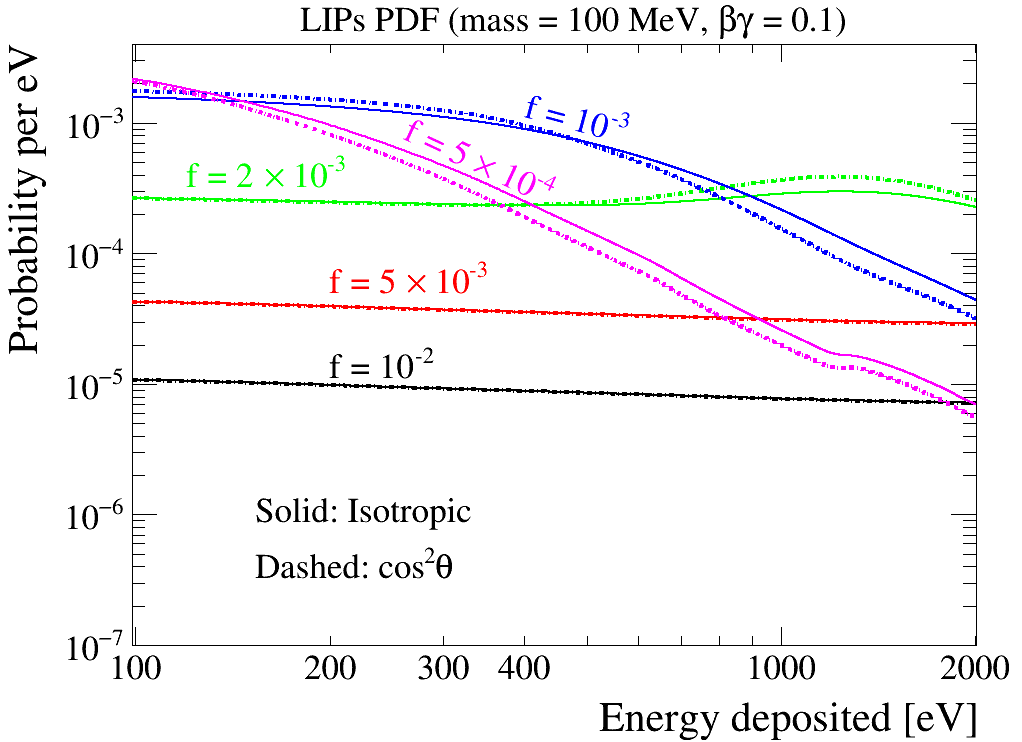
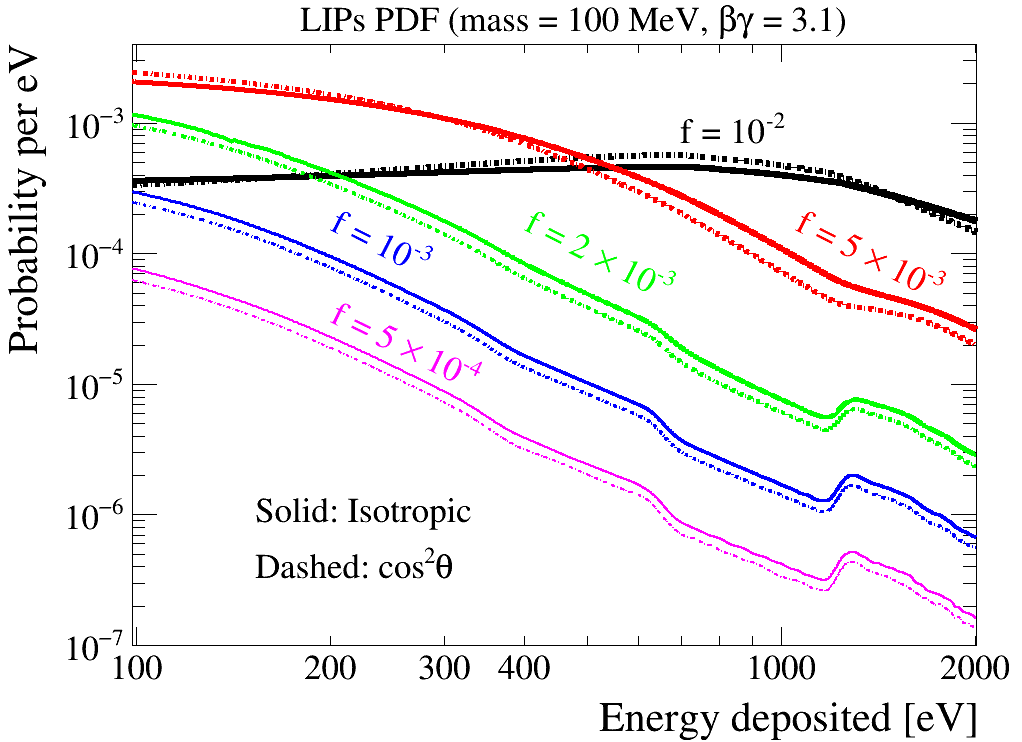
The ionization process is the dominant process resulting in energy depositions within the analysis region. Other processes like Bremsstrahlung, pair production typically deposits energy outside of our analysis region. The figures below are for LIPs of mass 100 MeV/c2. The LIPs results within our analysis region primarily depends on βγ values not on mass. So, the figures are valid for all mass range considered for the specified βγ values.
Results
Topic
Last Updated
Comments/Download

LIPs PDFs for different charges of βγ 0.1
June 25, 2019
This figure shows the probability distribution functions for a variety of LIPs charges (fe) between e/100 to e/2000 of mass 100 MeV/c2and βγ 0.1. The PDFs obtained from the simulations are smeared with the CDMSlite Run 2 detector energy resolution and smoothed. The solid lines are PDFs for isotropic angular distribution and the dotted lines are for cos2θ angular distribution.

LIPs PDFs for different charges of βγ 3.1
June 25, 2019

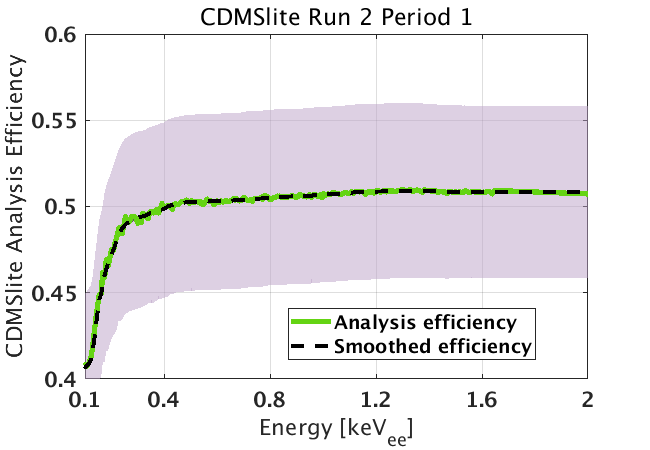
CDMSlite Run 2 period 1 WIMP search efficiency
November 25, 2019

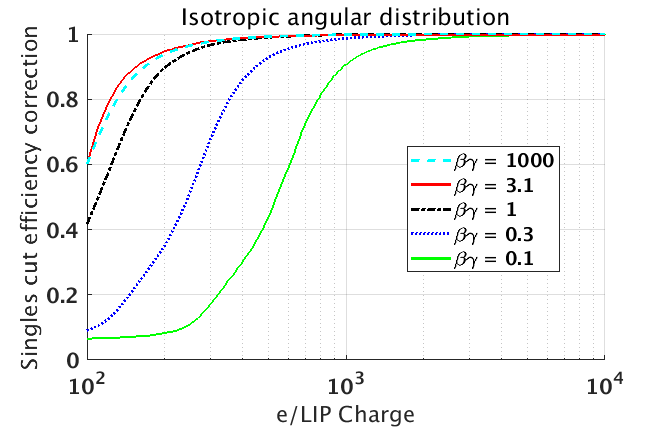
Singles cut efficiency correction (isotropic distribution)
November 25, 2019
This figure shows the fraction of LIP events expected to be rejected because of LIP interactions resulting in above threshold energy depositions in other detectors. This additional inefficiency of the singles cut for LIPs analysis is shown in the figure assuming an isotropic angular distribution for a variety of βγ. The efficiency is lowest for e/100 where energy depositions are largest increasing the probability of a LIP depositing detectable energy in at least one other detecor. The efficiency rapidly rises as the LIP charge decreases for all βγ. High statistical simulation results in statistical uncertainties smaller than the data points.

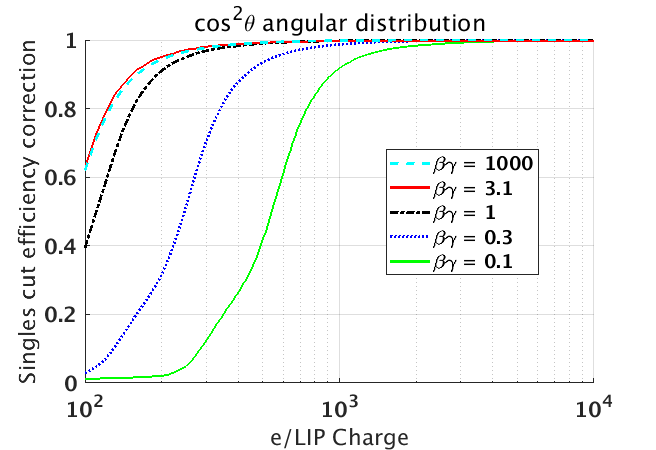
Singles cut efficiency correction (cos2θ distribution)
June 25, 2019

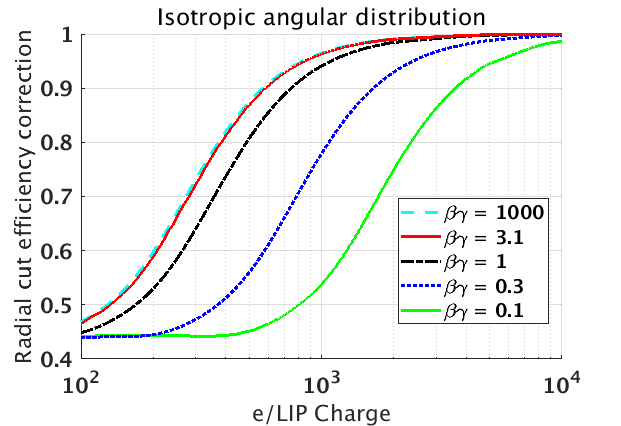
Radial cut efficiency correction (isotropic distribution)
Nov 25, 2019
Event reconstruction is not optimized for events with multiple interaction points. This figure shows the inefficiency resulting from the assumption that all LIPs interacting multiple times within the CDMSLite detector are rejected. This additional inefficiency of radial cut for LIPs analysis with isotropic distribution for various beta gamma is shown in the figure. The efficiency is low for e/100 LIPs as they have a higher probability of interacting more than once with in the same detector. The efficiency quickly increases for smaller fractional charges as the probability for interaction decreases. High statistical simulation results in statistical uncertainties smaller than the data points.

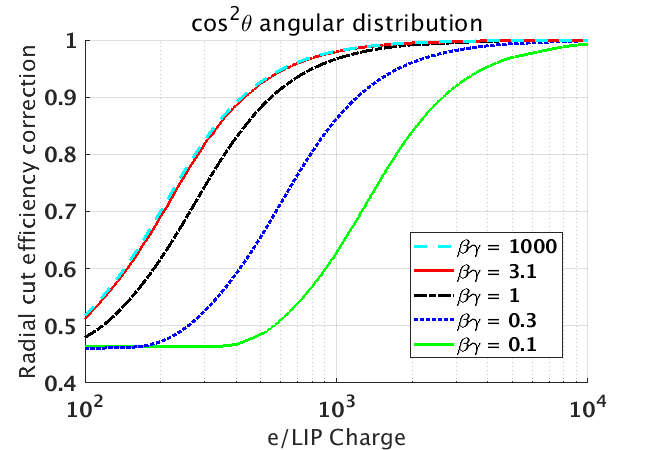
Radial cut efficiency correction (cos2θ distribution)
Nov 25, 2019

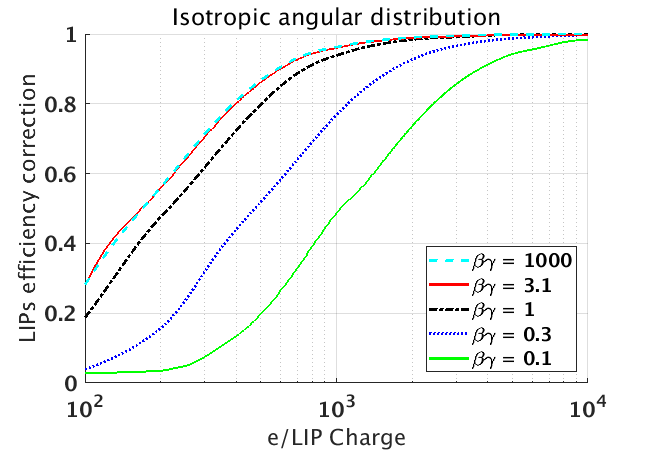
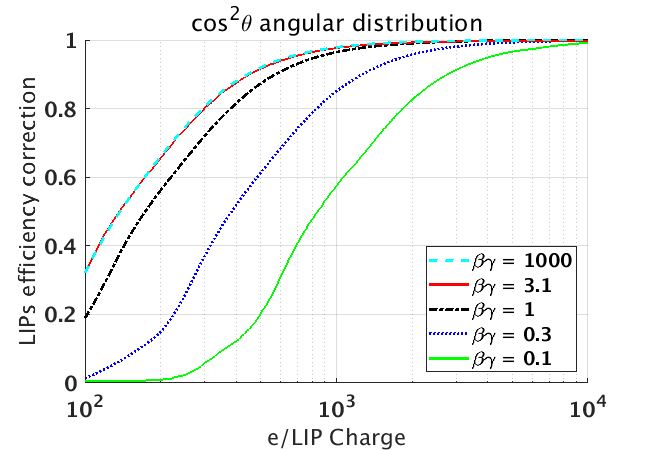
Additional LIPs efficiency correction (isotropic distribution)
Sep 16, 2019

Additional LIPs efficiency correction (cos2θ distribution)
Nov 25, 2019

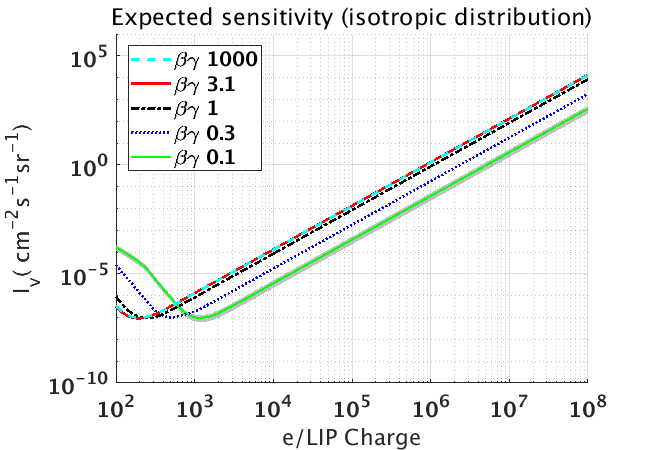
Vertical intensity limit projection
for LIPs (isotropic distribution)
Nov 25, 2019
The figure shows the sensitivity to LIP vertical intensity, flux of vertically incidenting LIPs, as function of LIP electric charge for various βγunder the assumption of an isotropic angular distribution. The combined statistical and systematic uncertainty is shown by the shaded region which is similar for all the curves and is dominated by uncertainty in CDMSlite Run 2 period 1 efficiency, systemic uncertainty in PDFs and statistical uncertainties in background. For clarity, the uncertainty band is only shown for βγ 0.1.

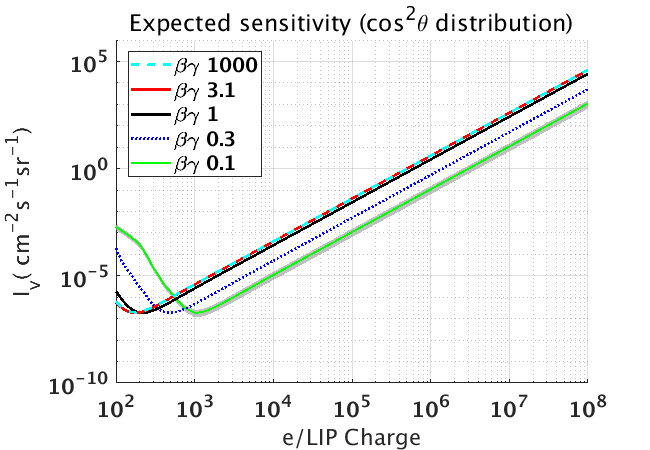
Vertical intensity limit projection for LIPs (cos2θdistribution)
June 25, 2019
After quasi-unblinding

Energy spectrum CDMSlite Run 2 period 1
Jan 24, 2020
This figure shows the energy spectrum obtained from CDMSlite Run 2 period 1 after the application of all the analysis selection criteria. A total of 180 events survived all the selection criteria. The activation lines L-shell at 1.30 keVee and M-shell at 0.16 keVee are clearly visible in the spectrum.

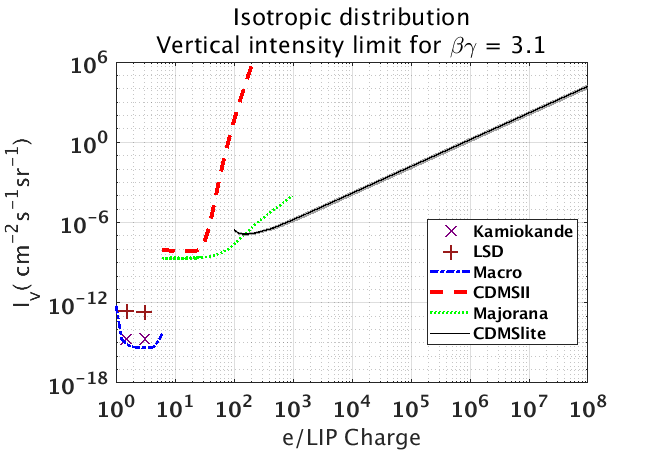
Comparing CDMSlite vertical limits to other experiment
Jan 24, 2020
The figure shows the 90% confidence limit (in black) placed on the vertical intensity by our analysis of CDMSlite under standard LIPs assumptions for minimally ionising LIPs (βγ = 3.1) with mass 100 MeV and assuming an isotropic distribution. For comparison all prior results of experiments that performed direct searches for cosmogenic LIPs are also shown. Under our assumptions, the CDMSlite LIPs search is the most sensitive to all LIPs charges smaller than e/160. e/160 is also the value for the LIPs charge at which our analysis places its best limit on the vertical intensity of 1.36×10⁻⁷cm−2s−1sr−1. The grey band illustrates the 1-sigma uncertainty on CDMSlite vertical intensity limit. This includes the uncertainty on CDMSlite analysis cut efficiency, higher and lower energy thresholds and statistical uncertainty in LIPs PDFs.

Vertical intensity limit for LIPs (isotropic distribution)
Jan 24, 2020
The figure shows the 90% confidence limit on LIPs vertical intensity as a function of LIP electric charge for various assumed βγ. The sensitivity limit is computed under the assumption of an isotropic angular distribution. The uncertainty in this curve is the same as for projected sensitivity as shown in Figure 10. However, this uncertainty doesn't include statistical uncertainty in the projected number of actual events in simulated background. For clarity, the uncertainty band is only shown for βγ = 0.1.

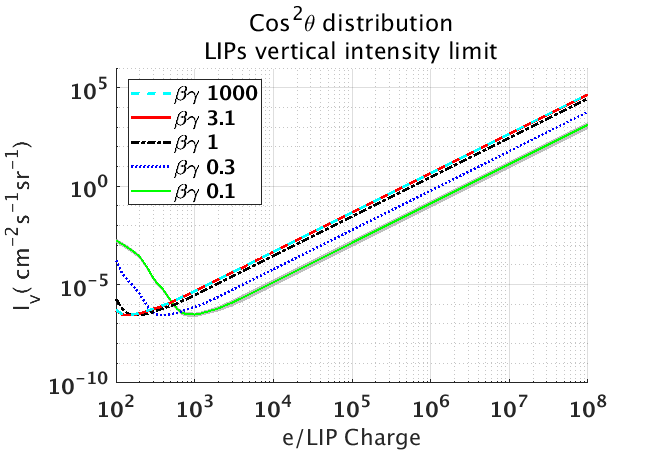
Vertical intensity limit for LIPs (cos2θ distribution)
Jan 24, 2020
Comparing Intensity limits with projected sensitivity

Energy spectrum CDMSlite Run 2 period 1 vs sample projected background
Jan 24, 2020
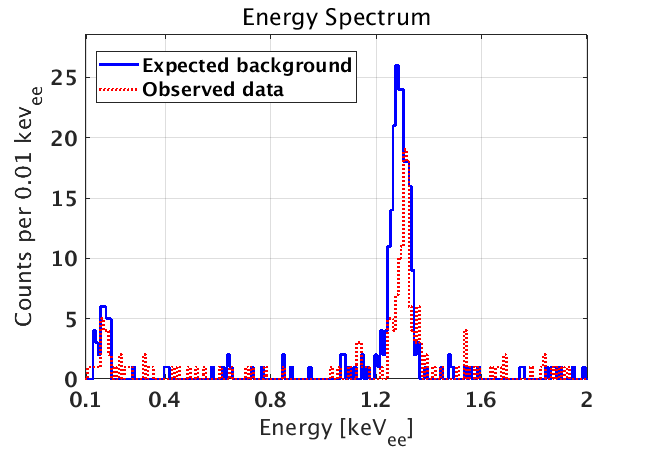
This figure shows the energy spectrum obtained from CDMSlite Run 2 period 1 in red along with one of the typical simulated background using the model developed by CDMSlite (More info) . There are two significant differences between observed and expected data. (1) We observed fewer events in the activation peaks than expected. The model's prediction was scaled by livetime to generate an expected background spectrum but the scaling was incorrect for the activation peaks due to lack of calibration throughout Run 2 period 1. After the application of correct scaling, the events in the peaks were found to be as expected. (2) The mean value of the L- shell shifted by 0.5% which was slightly more than expected, however, the uncertainty applied to the energy scale before unblinding was ~5 times greater than this. Therefore, in worst case scenario with 0.5% uncertainty on the calibration, the effect would still be small compared to existing uncertainties on the energy scale.

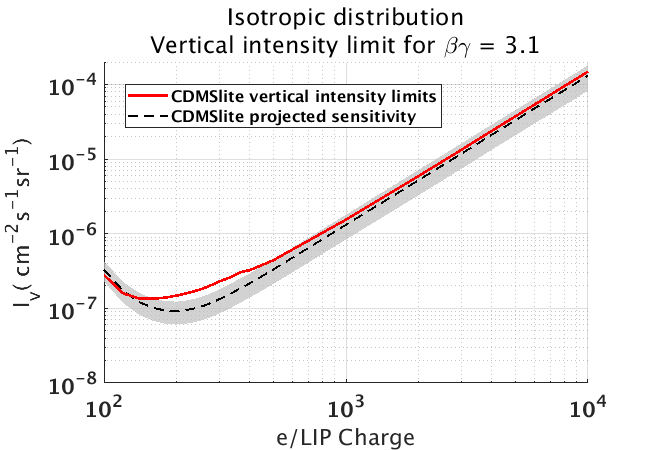
Vertical intensity limit vs Projected sensitivity for βγ3.1
Jan 24, 2020
The figure compares the LIPs projected sensitivity shown in the Figure 10 with 90% confidence limit on vertical intensity shown in the Figure 13 and Figure 14 under the standard assumption of minimimun ionization. The actual limit falls within our expectation except for some LIPs charges around e/300. Figure 18 and Figure 19 below describe the reason for that difference.

Percentage difference between Projected sensitivity and vertical intensity limit for βγ 3.1
Jan 24, 2020

PDF of LIPS with βγ 3.1 over energy range with optimum sensitivity
Jan 24, 2020
The figure shows the Probability distribution function (PDF) for minimum ionizing LIPs with electric charge e/200, e/300, and e/400 for the portion of the analysis region with the greatest sensitivity. Our postmortem analysis showed that there were a few more events within this region in the data spectrum than predicted by the model. The increased number of events within this region of greatest intensity leads to a reduced limit on the vertical intensity. 4 out of 10 events between 0.2 and 0.4 keV occurred in the 15% of the livetime immediately after calibration activation. LIPs probability distributions shown have unit probability within the analysis window. LIPs with electric charge e/300 are expected to sample this region the most resulting in the greatest reduction in their sensitivity, as shown in Figure 18.

Mass-charge parameter space for LIPs search
Jul 31, 2020
The figure shows constraints on FCP mass-charge parameter space from astrophysical observations, cosmic microwave background, big bang nucleosynthesis, and direct laboratory experiments.Direct-detection experiments MACRO (MA), CDMS II, MAJORANA, TEXONO and CDMSlite (this search) constrain the intensity of cosmogenic FCPs; other constraints are from accelerator based experiments (AC), ArgoNeut (AG), the search for the invisible decay of ortho-positronium (OP), the SLAC millicharged particle search (SLAC), the Lamb shift (L), the big bang nucleosynthesis (BBN), the plasmon decay in red giants (RG), the plasmon decay in white dwarfs (WD), the cosmic microwave background (CMB) and the Supernova 1987A (SN). CDMSlite extends experimental constraints on higher-mass FCPs to smaller values of f than have been previously probed. This analysis is the first to probe the impact of mass on the signal model. Only constraints for charges are shown for other direct searches. CDMSlite extends experimental constraints on higher-mass FCPs to smaller values of f than have been previously probed. This analysis is the first to probe the impact of mass on the signal model. Only constraints for charges are shown for other direct searches.