Dark Absorption in SuperCDMS Soudan
Abstract This Public Documentation accompanies the results on "Dark Absorption in SuperCDMS Soudan". Using data from CDMSlite (Runs 2 and 3) and select iZIP detectors from the SuperCDMS experiment at the Soudan Underground Laboratory, upper limits on the axioelectric coupling of axion-like particles (ALPs) and the kinetic mixing parameter of dark photons (DPs) are set. The analysis is based on Poisson statistics and assumes the respective particles constitute all of the galactic dark matter.
Citation: T. Aralis et al., Phys. Rev. D 101, 052008 (2020). DOI: PhysRevD.101.052008
eprint: 1911.11905
Note, an error in the code led to an improper determination of the efficiency in one portion of the analysis. The plots affected by this are the rate plot and each of the limit plots. This public documentation has been updated with the corrected versions of these plots.
All limits are at a 90% confidence level, assume a local DM density of ρDM = 0.3 GeV/cm3, and that either ALPs or dark photons make up all of the DM in the universe. gae is the axioelectric coupling. ε is the dark photon's kinetic mixing with the standard model photon. ma/mVis the ALP/DP mass. More detailed information on the assumed DM models and astrophysical parameters can be found in the US Cosmic Visions Community Report.
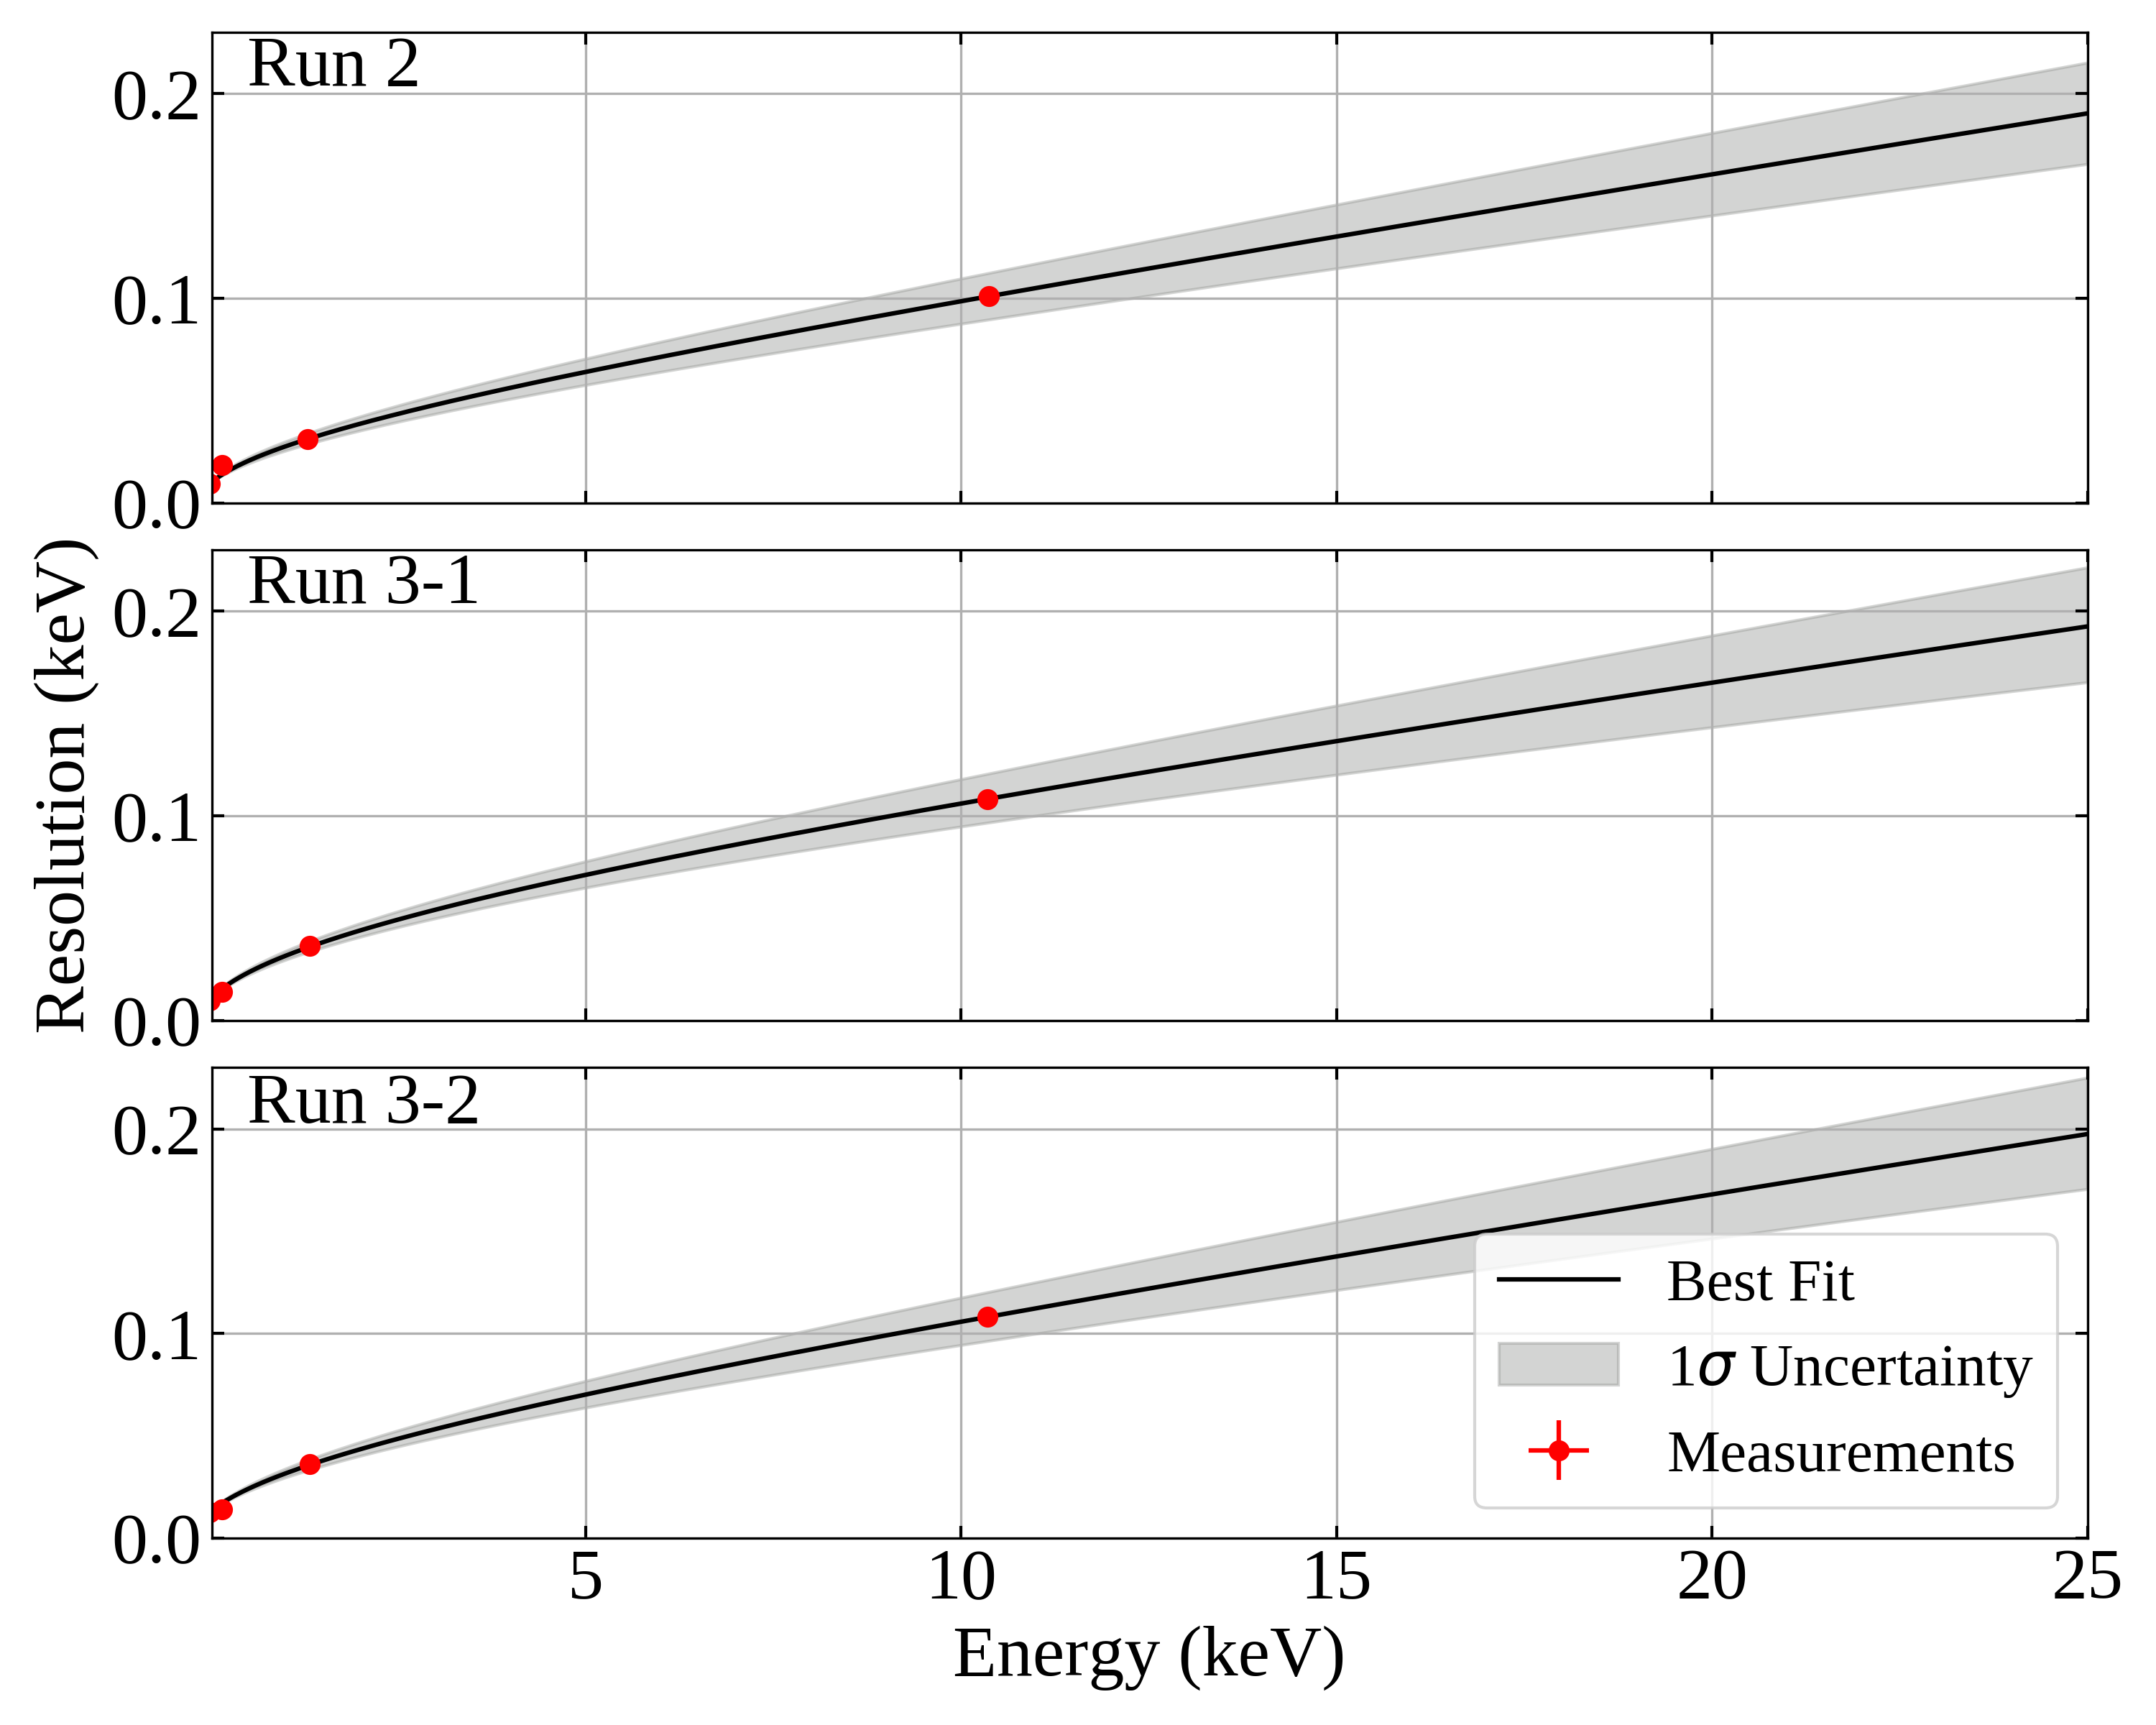
The detector's energy resolution model used is
where Er is the recoil energy and A, B, and σE are model parameters. For more details on the resolution model see the paper and references within.
Results
Topic
Download
Comments

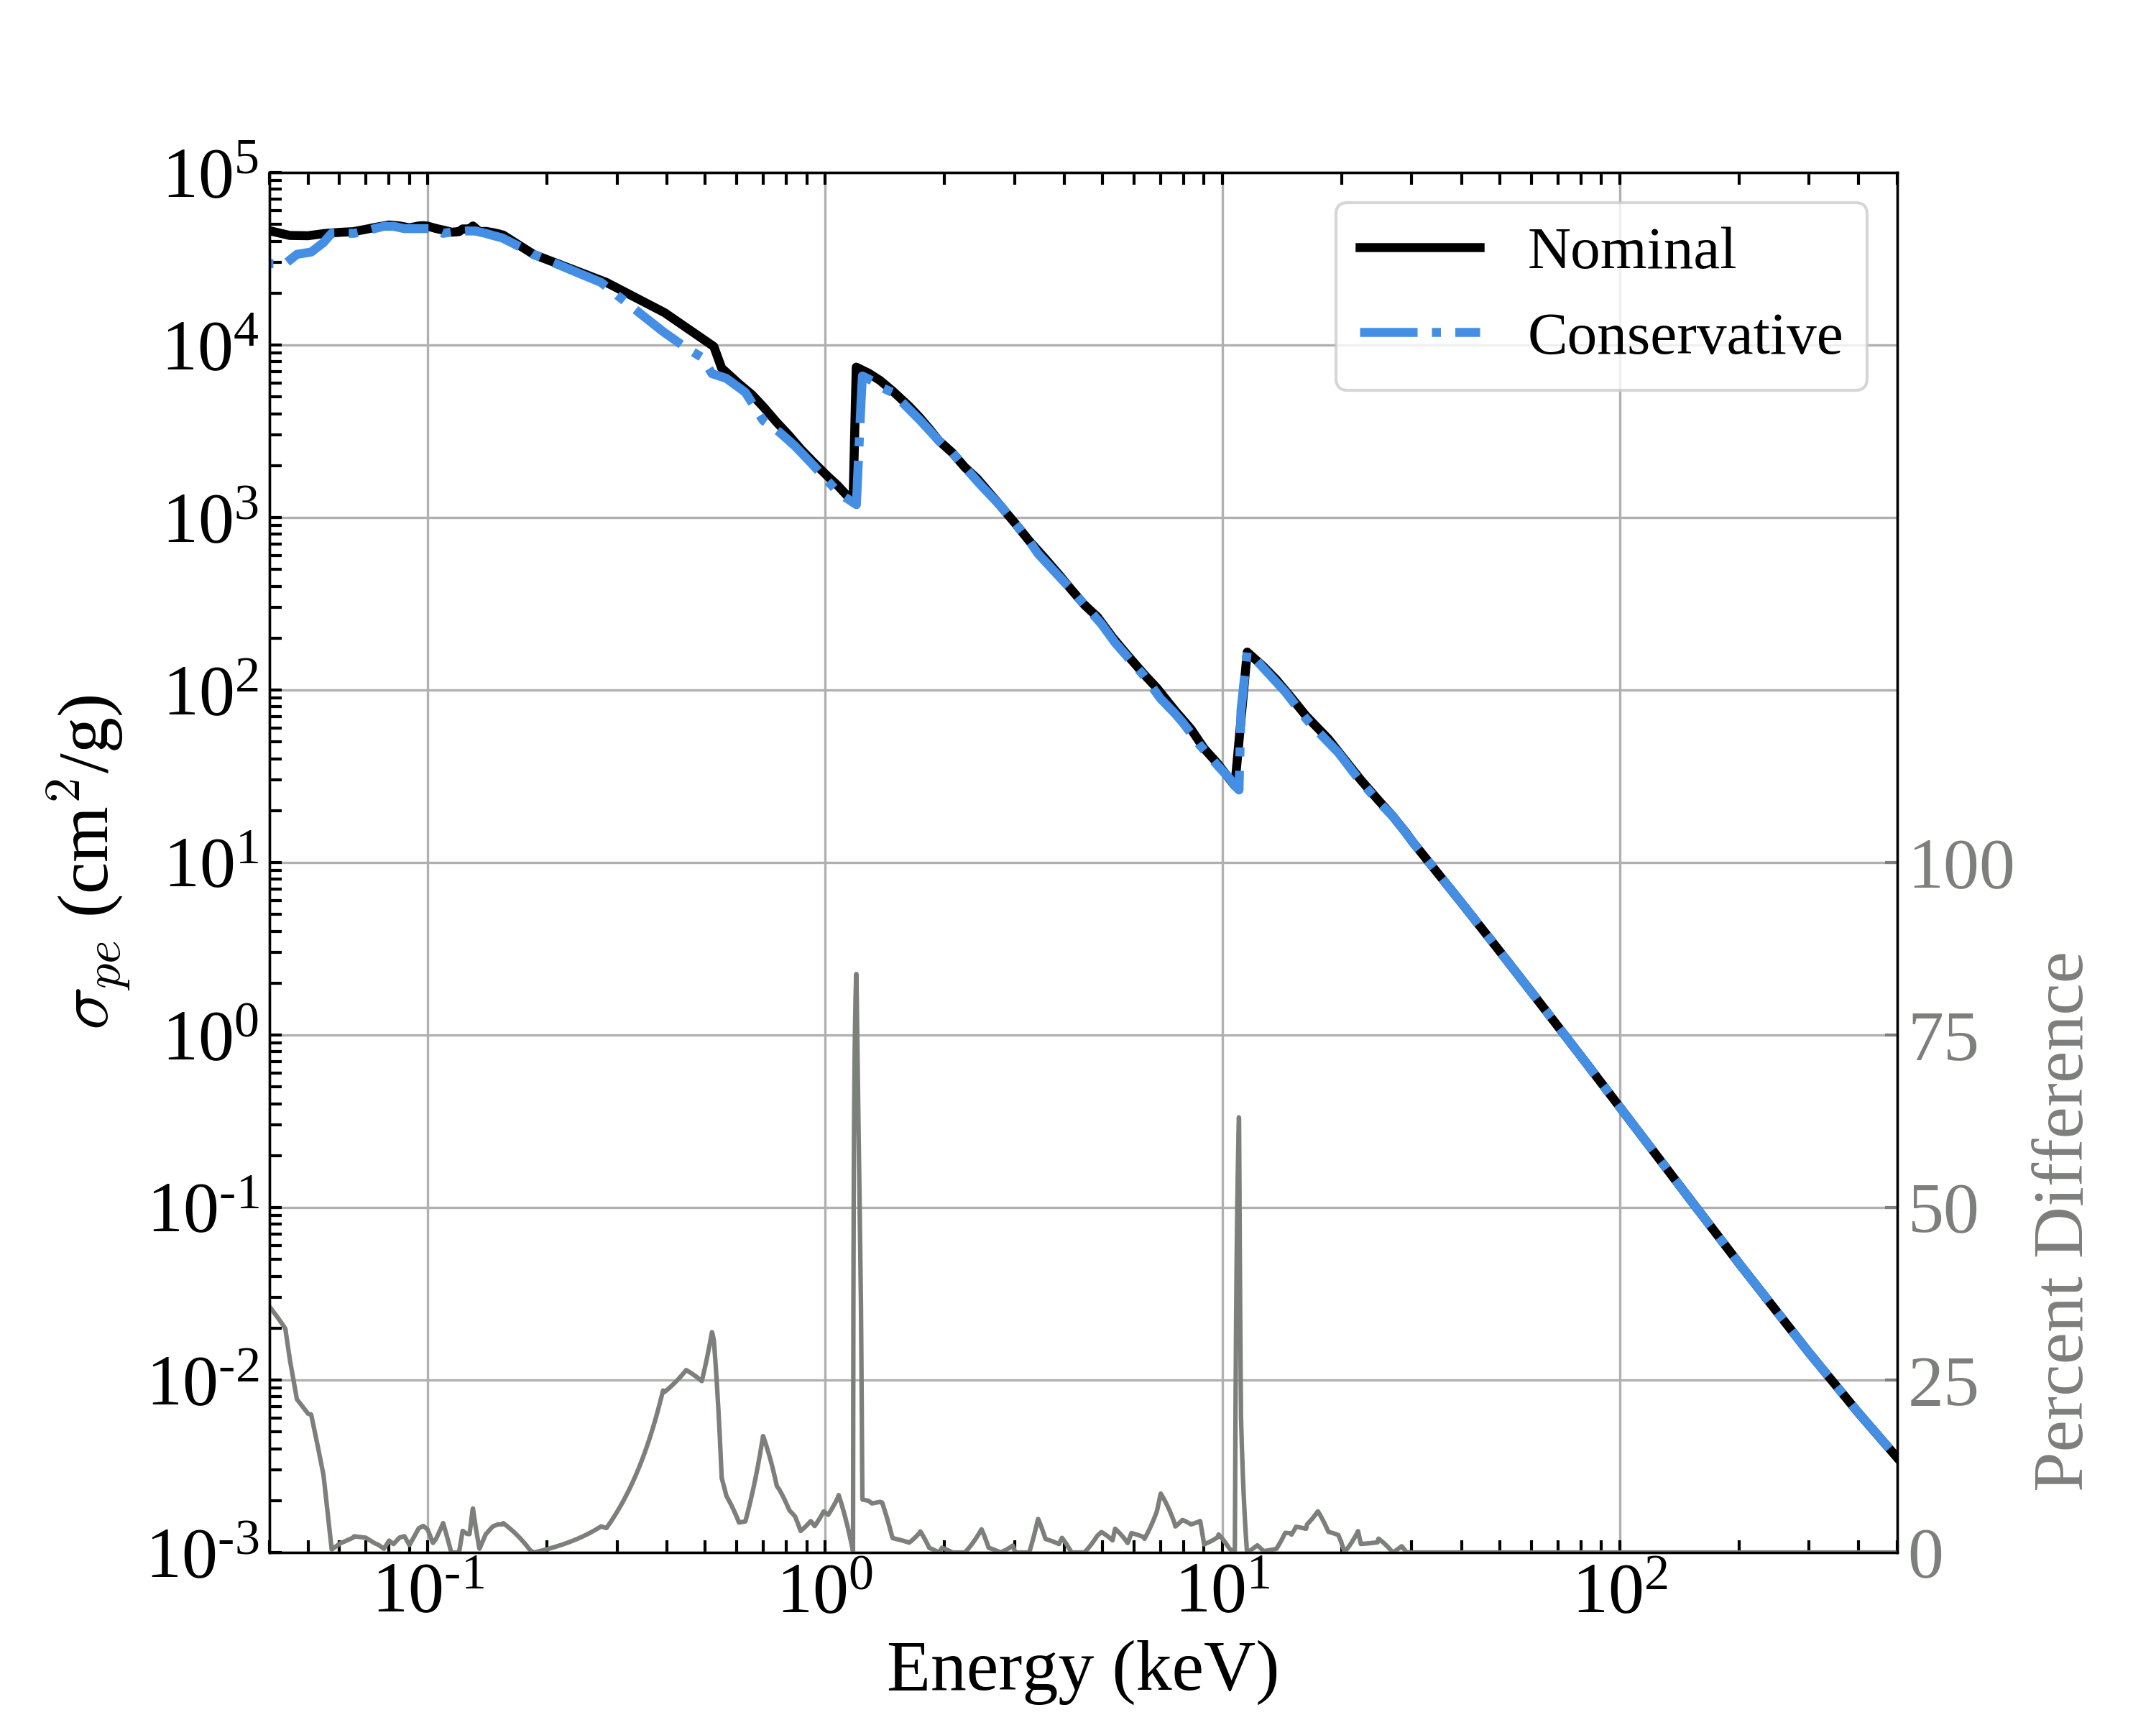
Photoelectric Cross Section
Photoelectric cross section σpe curve for Ge, in units of cm2/g. All data taken from literature, see paper for references. Solid black: nominal photoelectric cross section, obtained by using data from various sources in the literature. Dashed blue: conservative, determined by conservatively extracting the smallest σpe values in the literature. The grey line at the bottom shows the percent difference between the nominal and conservative photoelectric cross sections.

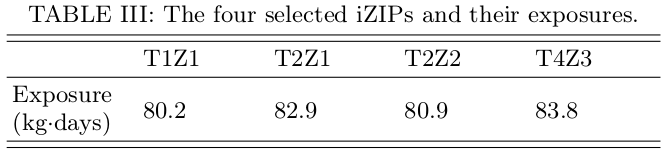
Detector Exposures
Dark matter exposures, in kg-days, for CDMSlite Runs 2 and 3, with Run 3 divided into its respective data taking periods (1 and 2).

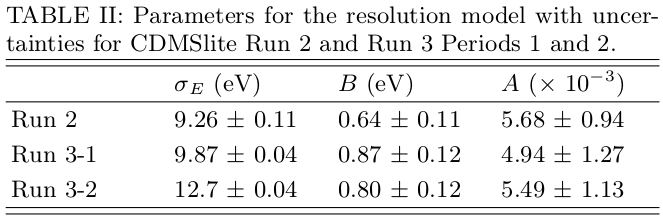
Resolution Model
The parameters of the CDMSlite resolution model determined by fitting to the measured values, with uncertainties on the fit, for the three CDMSlite data runs used.

Resolution Model
The CDMSlite energy resolution models, for Run 2 and Run 3 (for Periods 1 and 2). The best fit curve (black line) and 1-sigma uncertainty band (grey) are shown with the measured widths (red points) of the three Ge electron capture peaks and the baseline noise resolution. The top, middle, and bottom panels show the models for Run 2, Run 3 Period 1, and Run 3 Period 2, respectively.

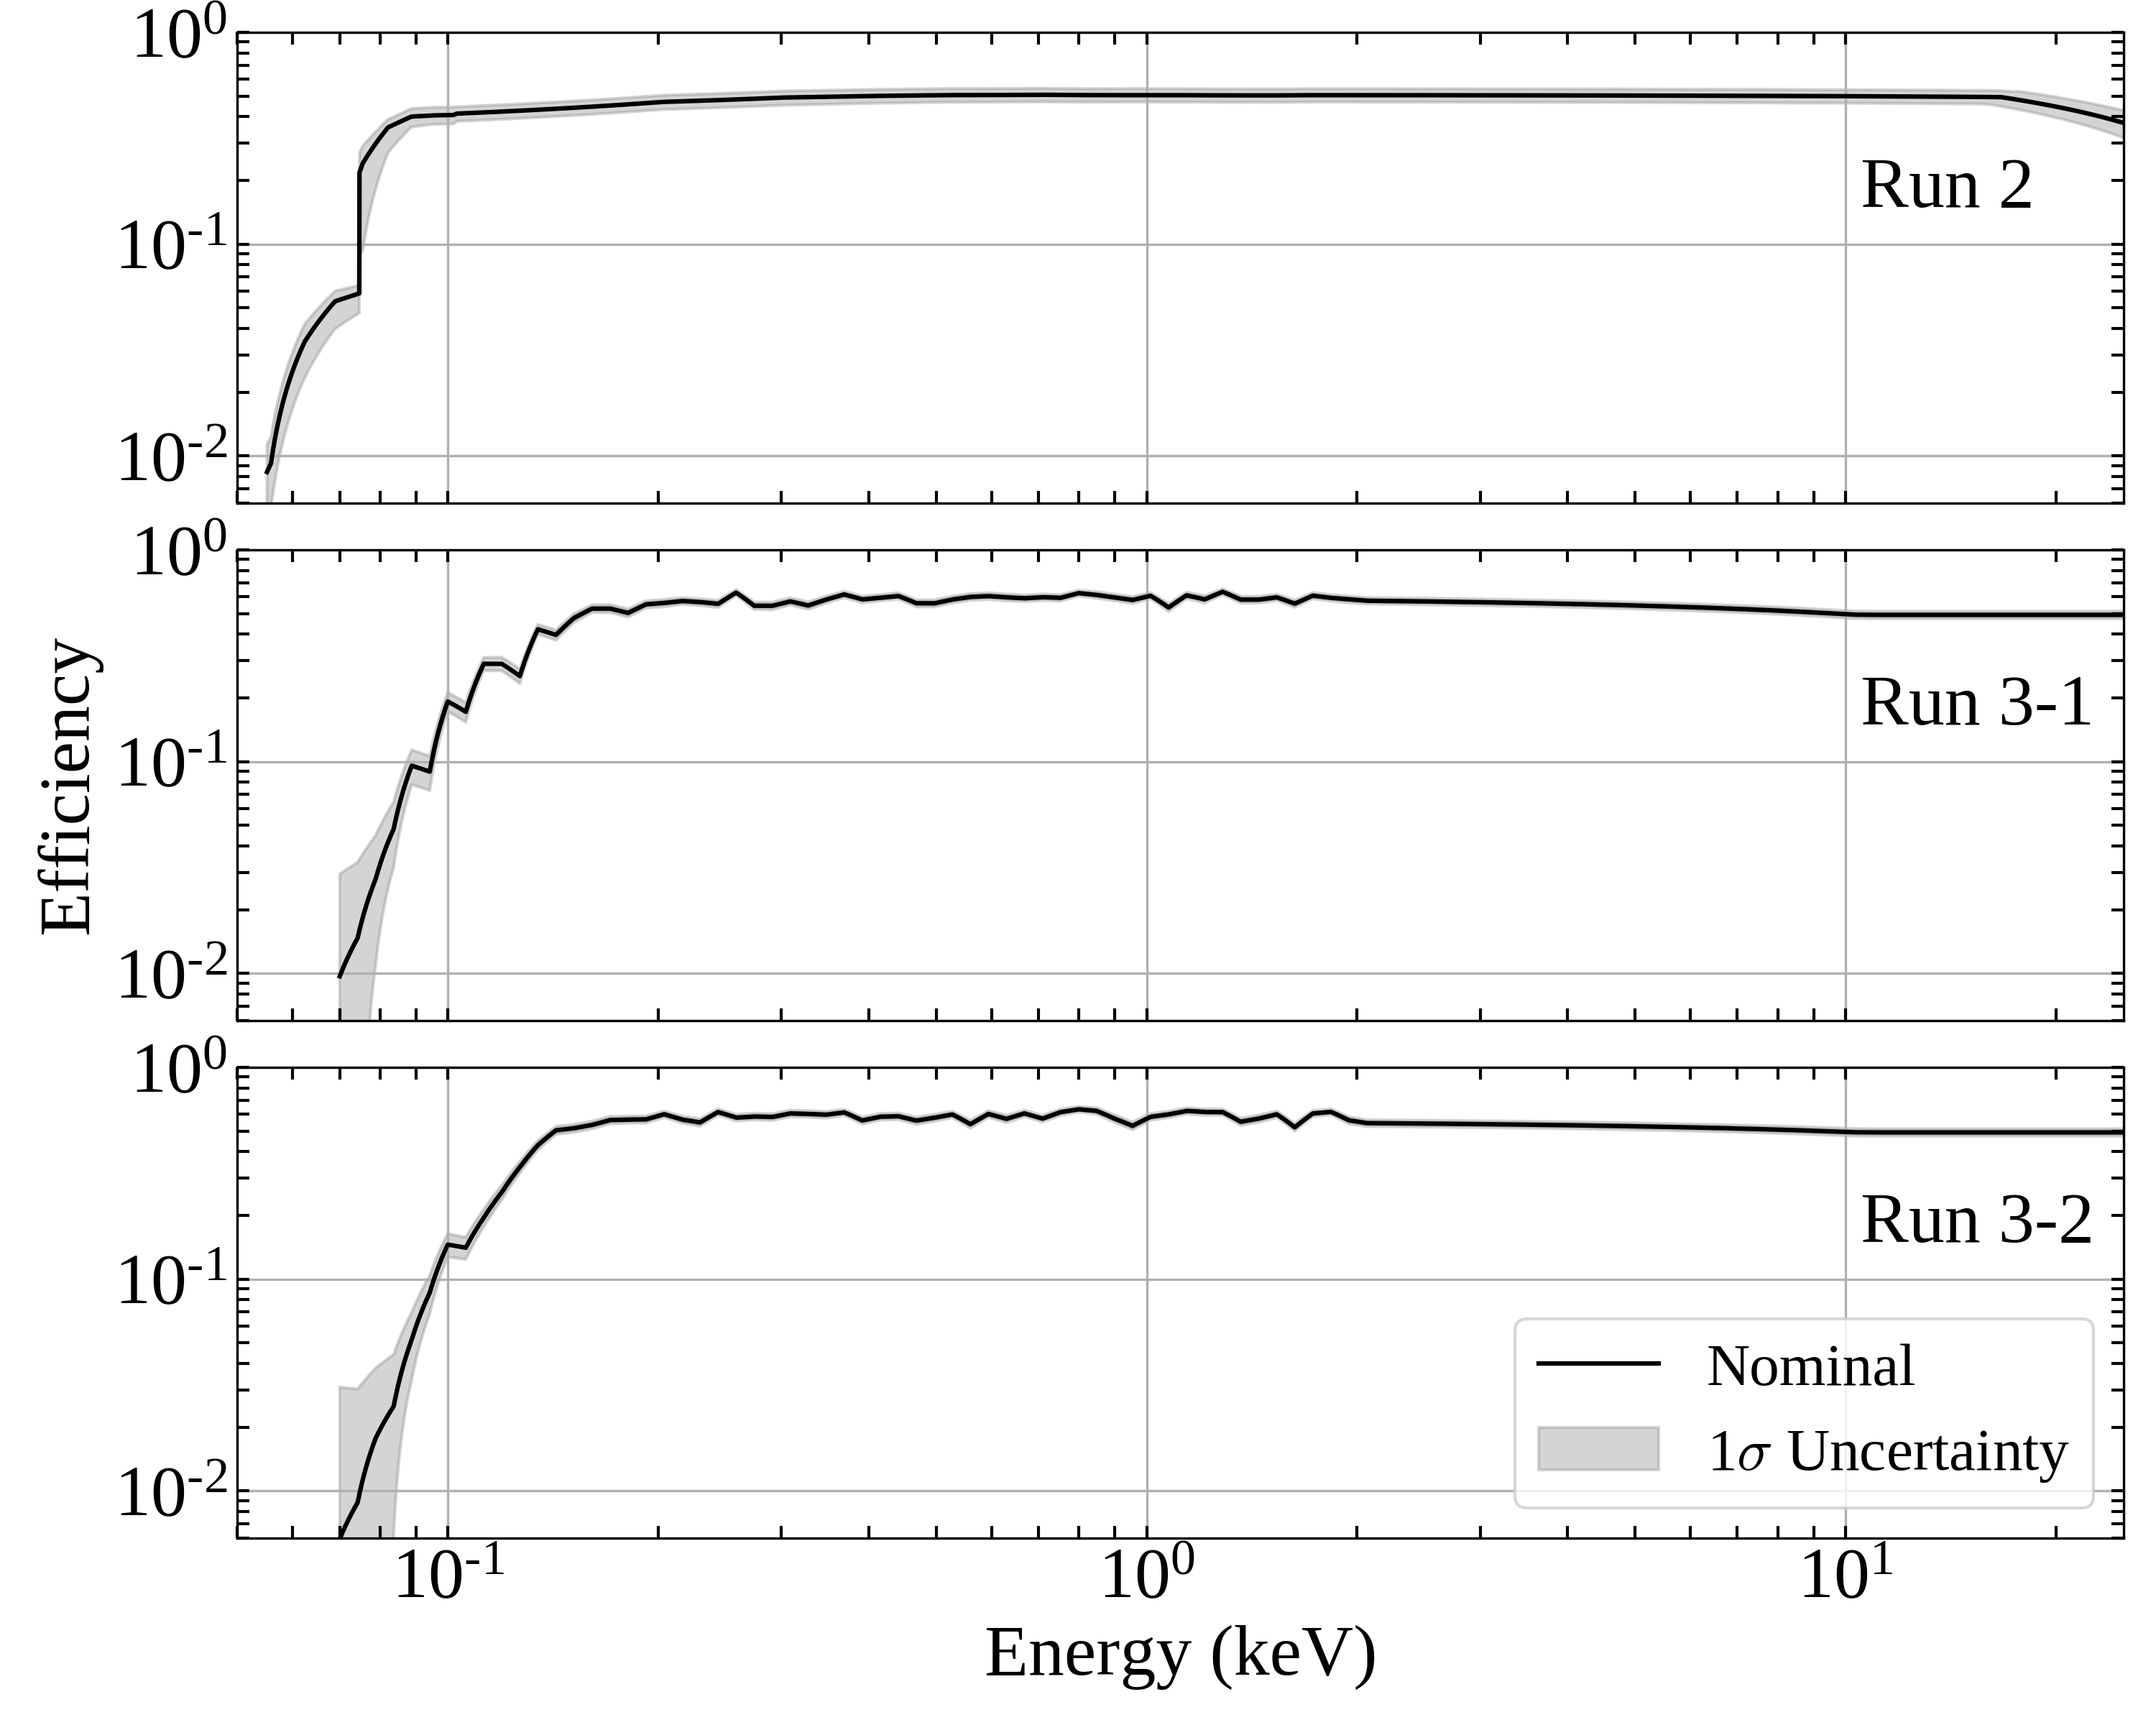
Efficiency Curve
Signal efficiency for CDMSlite Run 2, Run 3 Period 1, and Run 3 Period 2 in the top, middle, and bottom subplots respectively. The nominal efficiency (black line) and 1-sigma uncertainty band (grey) are shown in the relevant energy range.

Detector Exposures
Dark matter exposures, in kg-days, of the four selected iZIP detectors used in this analysis.

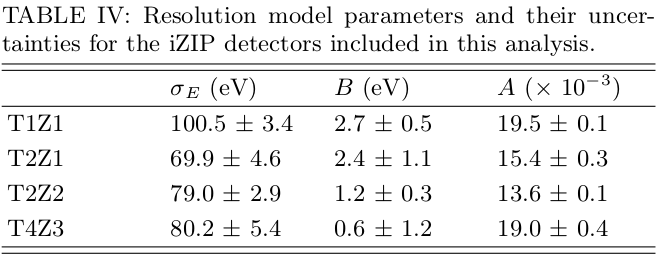
Resolution Model
The determined fit parameters for the resolution model for the iZIP detectors included in this analysis, with 1-sigma uncertainties on the fit.

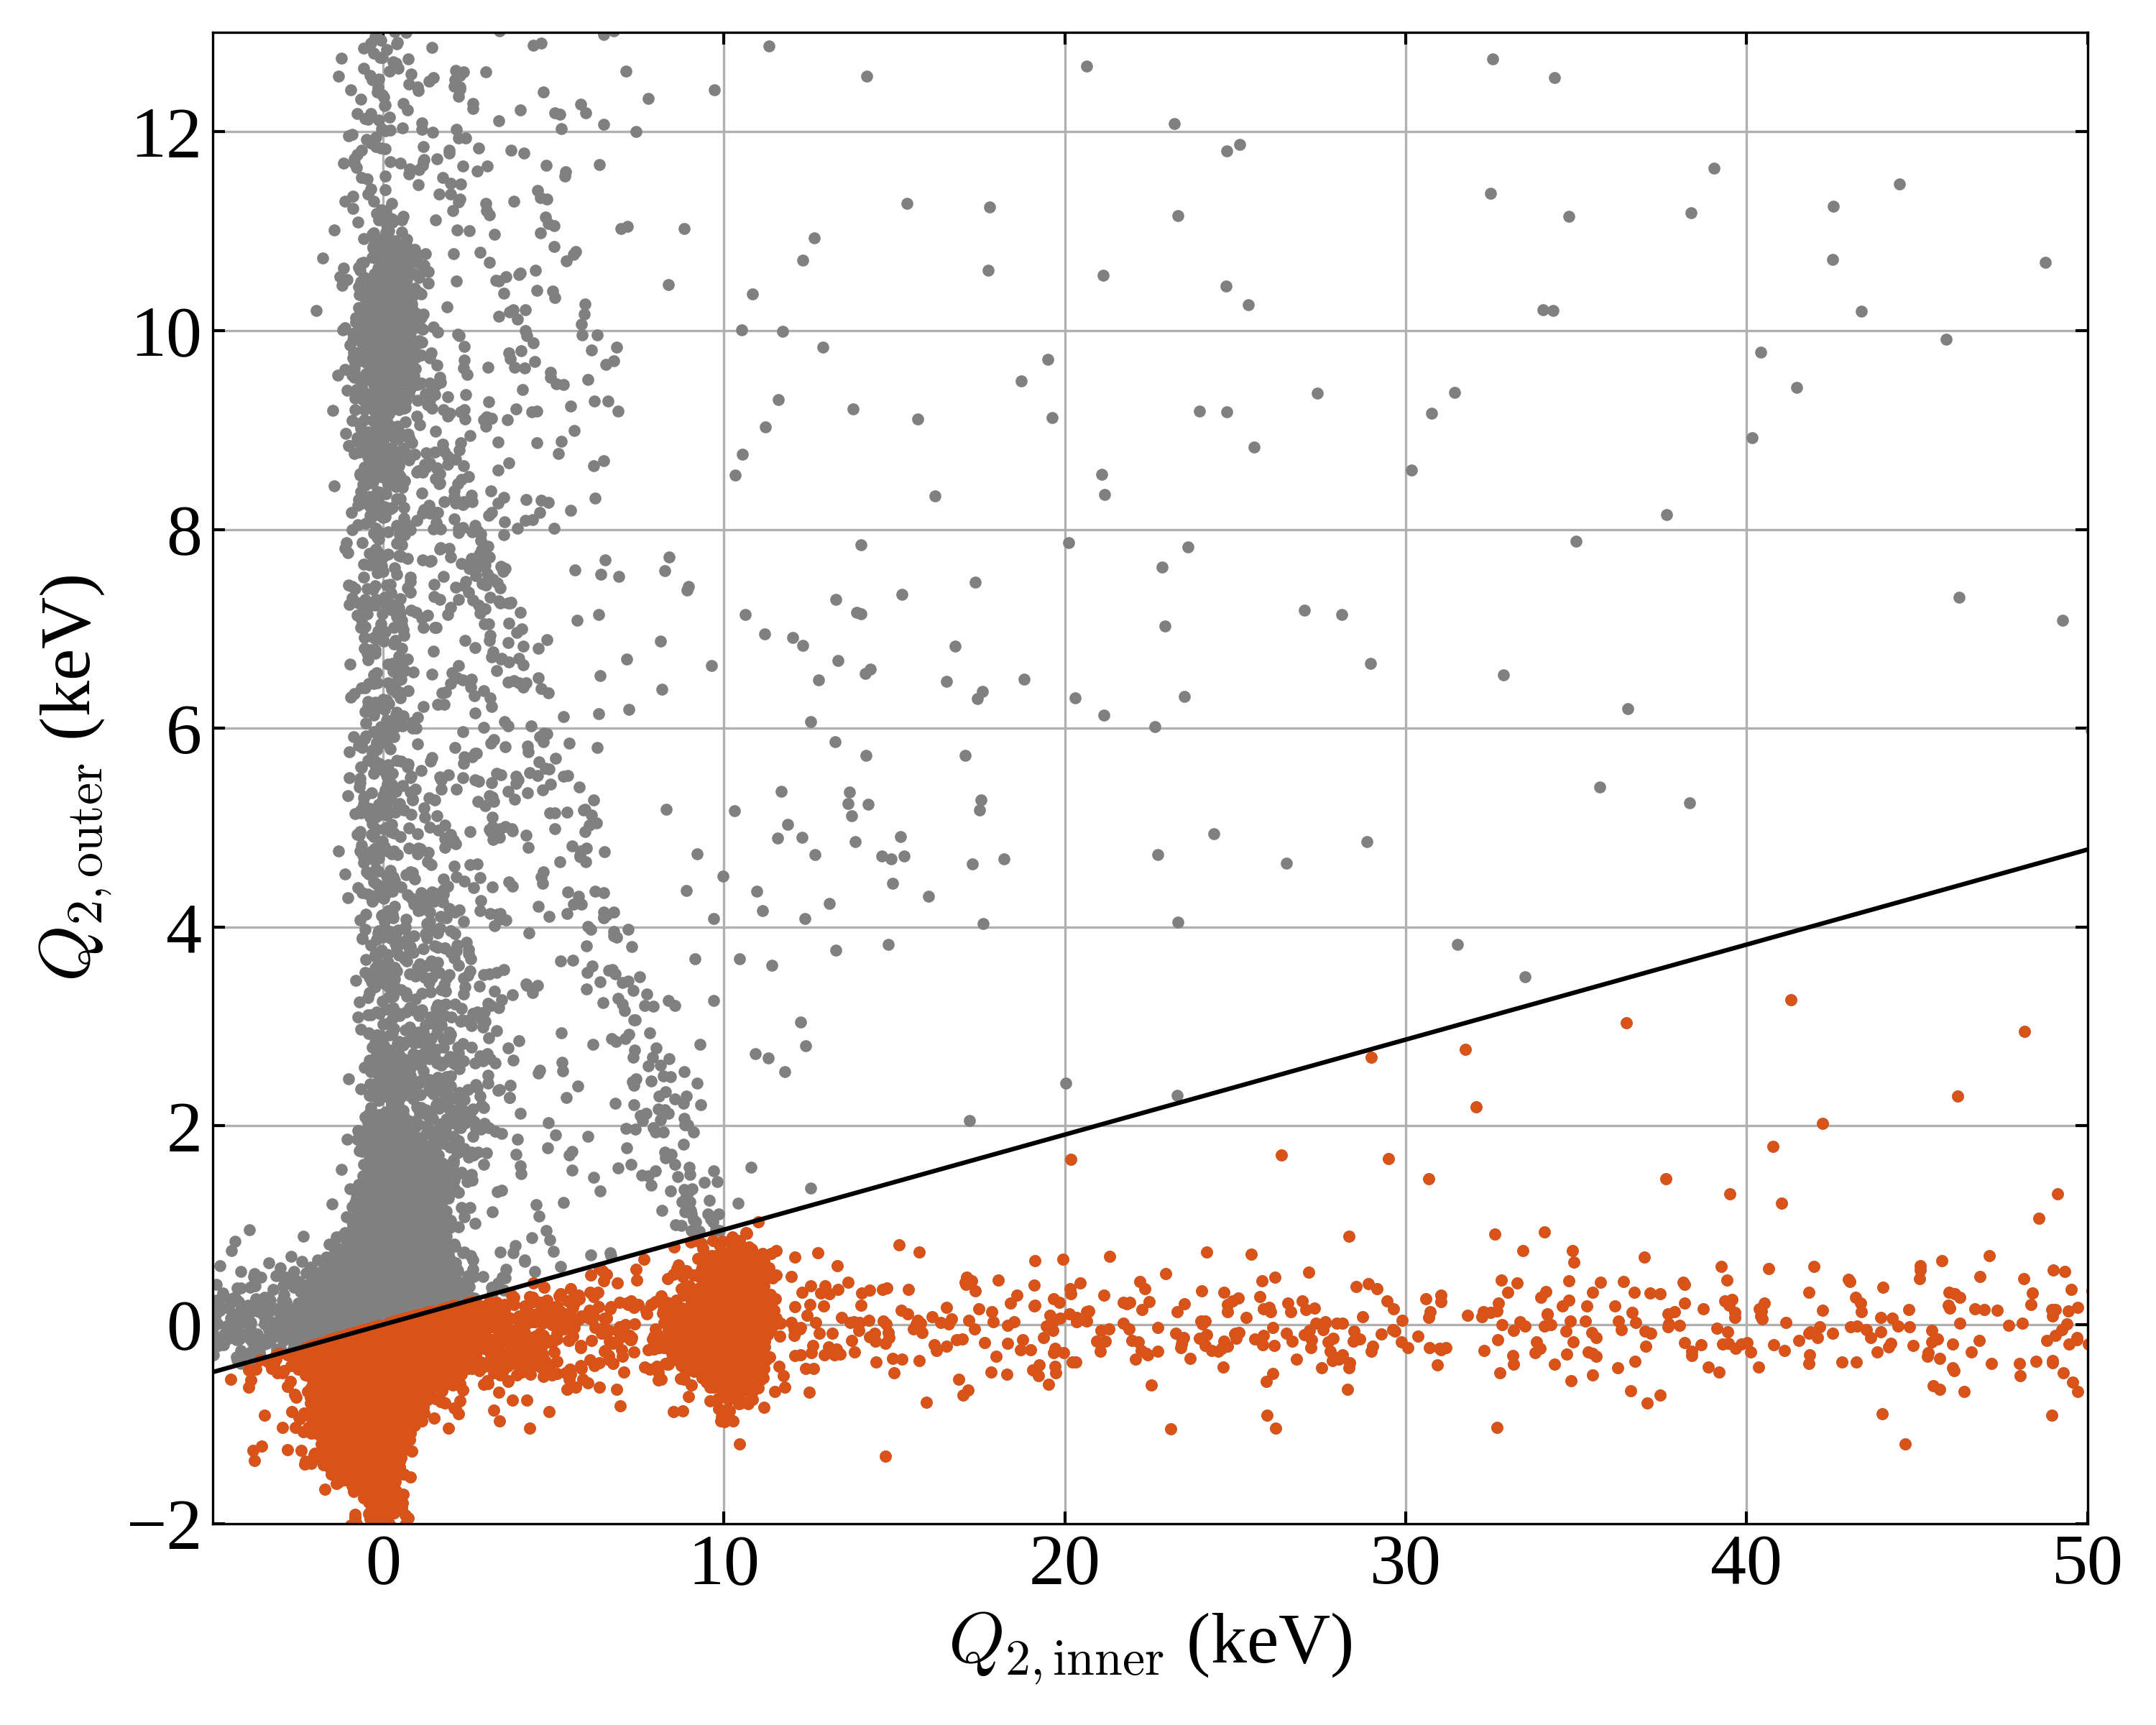
Event Selection
Signal amplitude in the outer vs. the inner charge channel for detector T2Z2. The black line shows the criteria that the radial charge cut uses to remove events where a certain fraction of the total signal is in the outer channel. The red events are events that are kept, while the grey events are events that are removed.

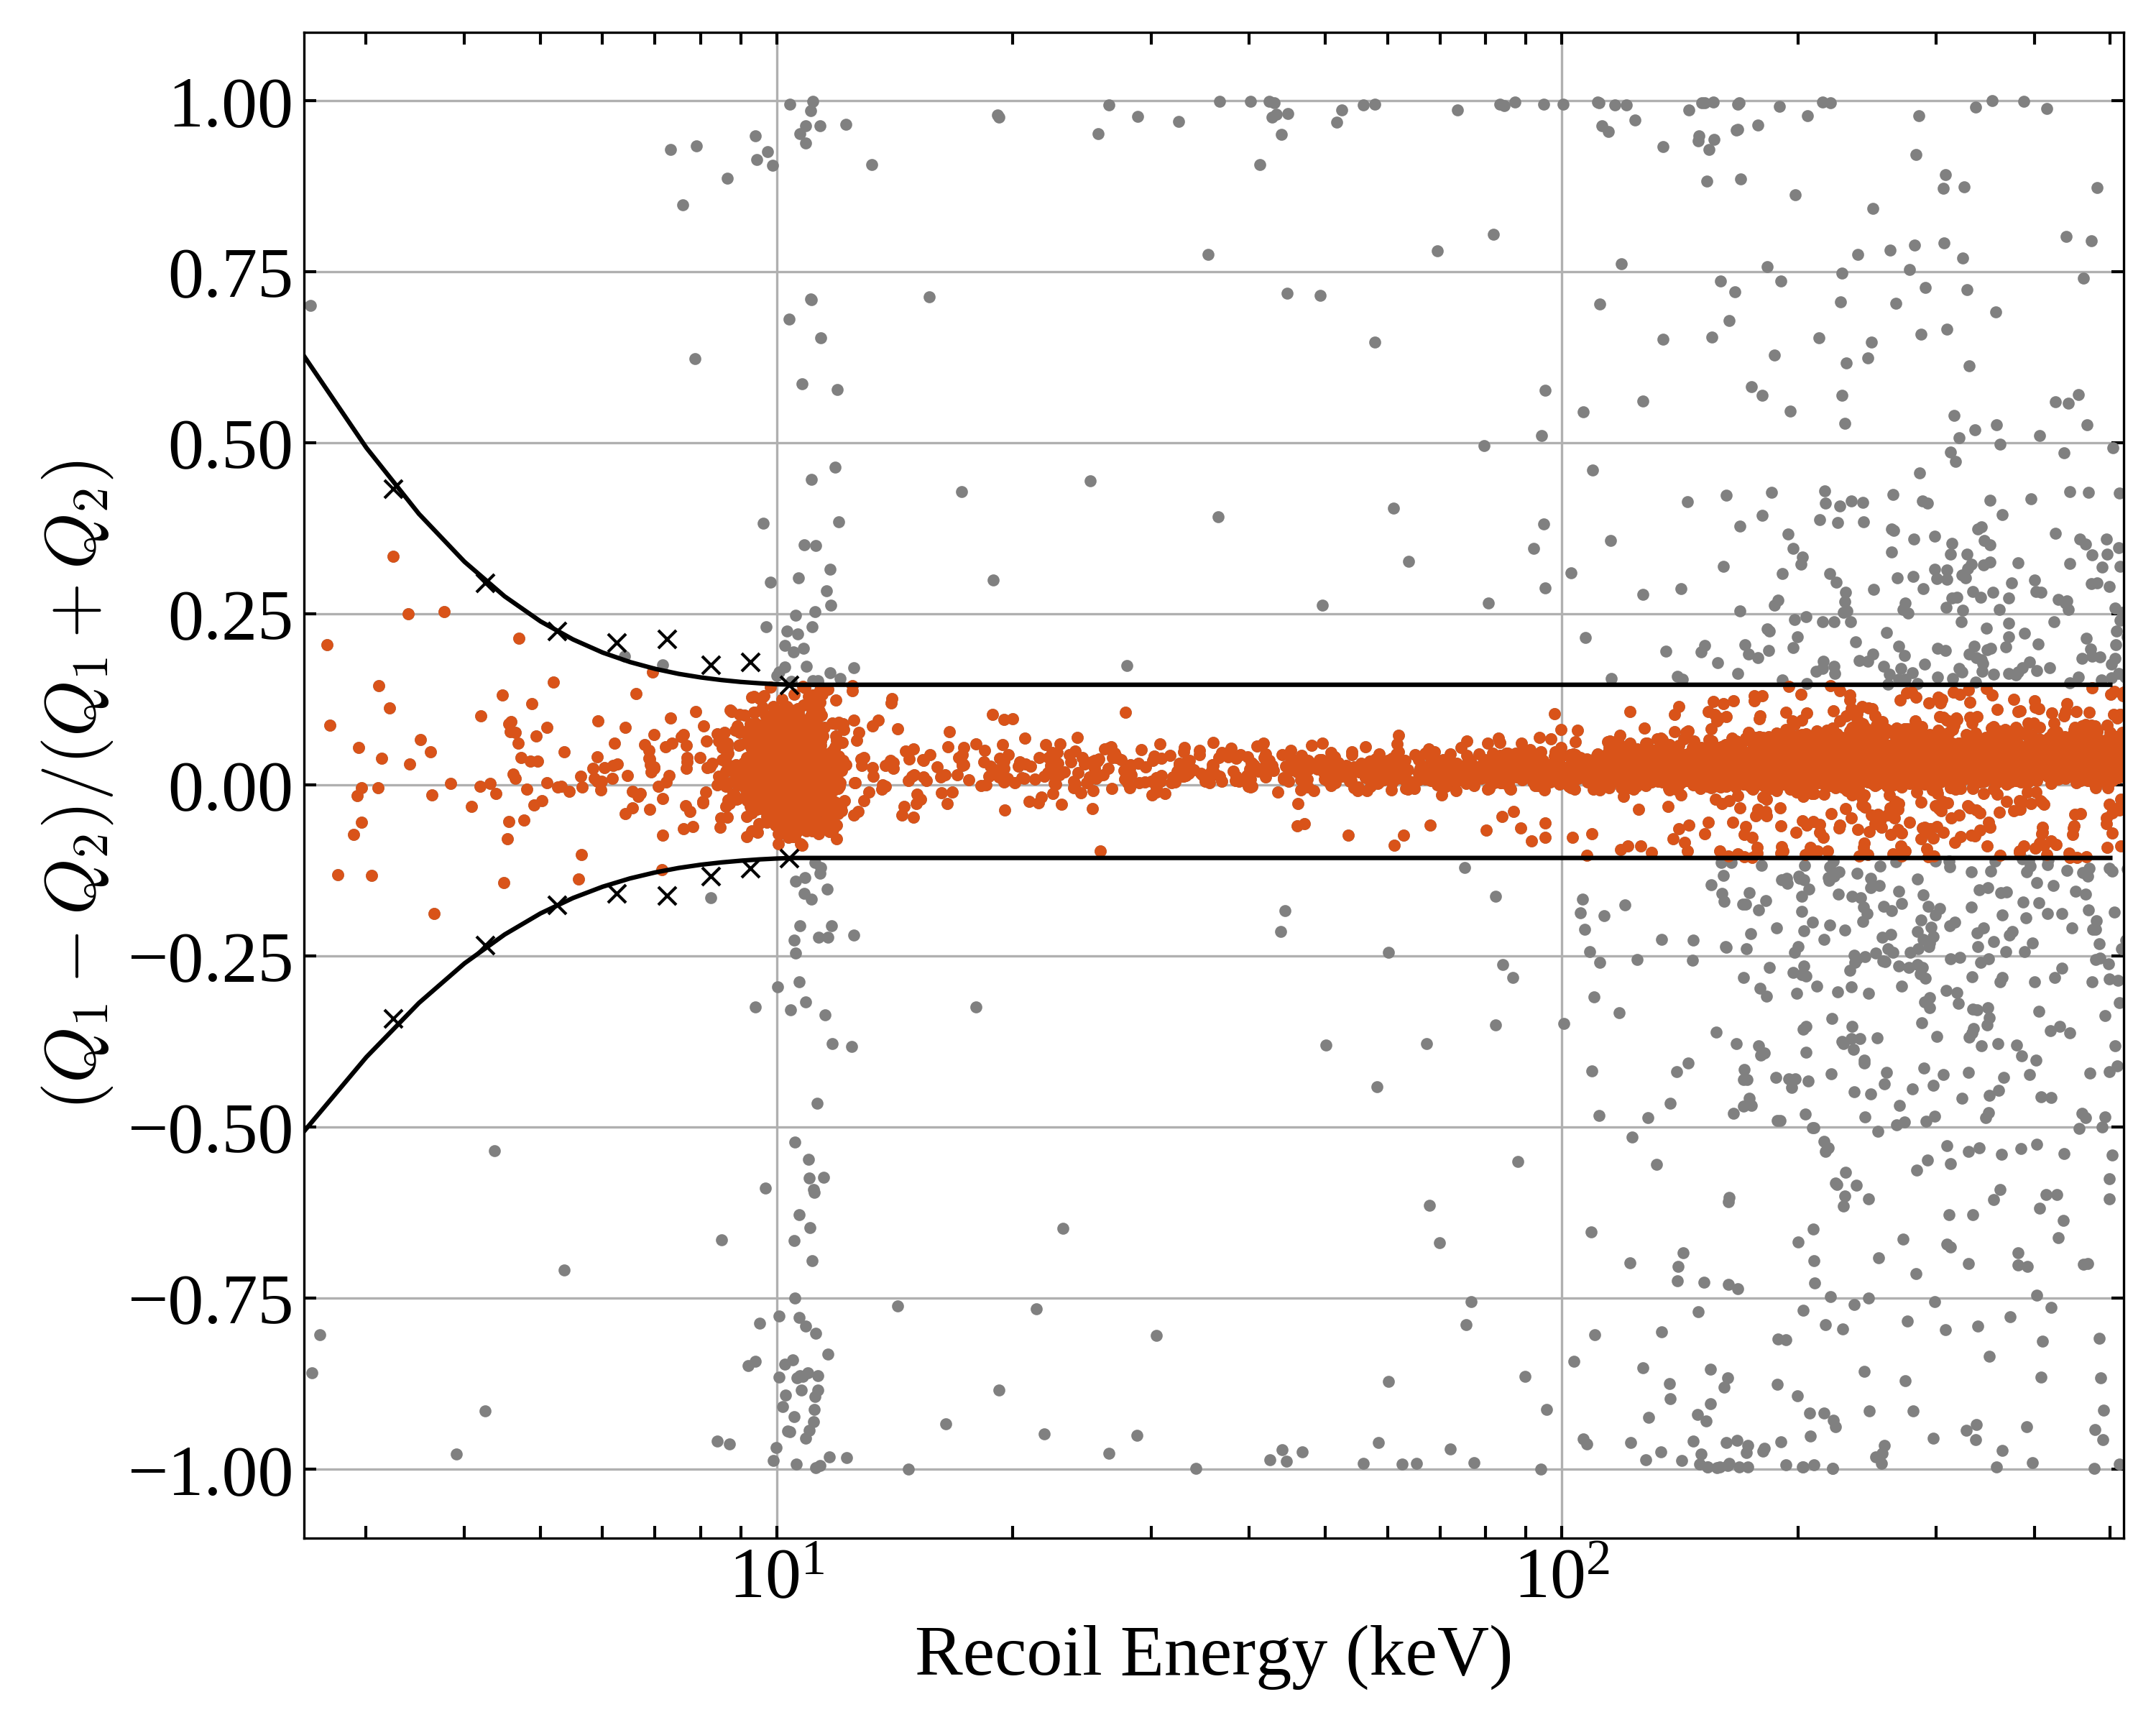
Event Selection
Charge symmetry cut parameter vs. total charge signal for detector T2Z2. Red events within the black lines pass the charge symmetry cut, while grey events outside of the black lines fail. The cut lines are exponential functions fit to the black crosses below the K-shell energy, above the K-shell energy the cut lines are constant.

Resolution Model
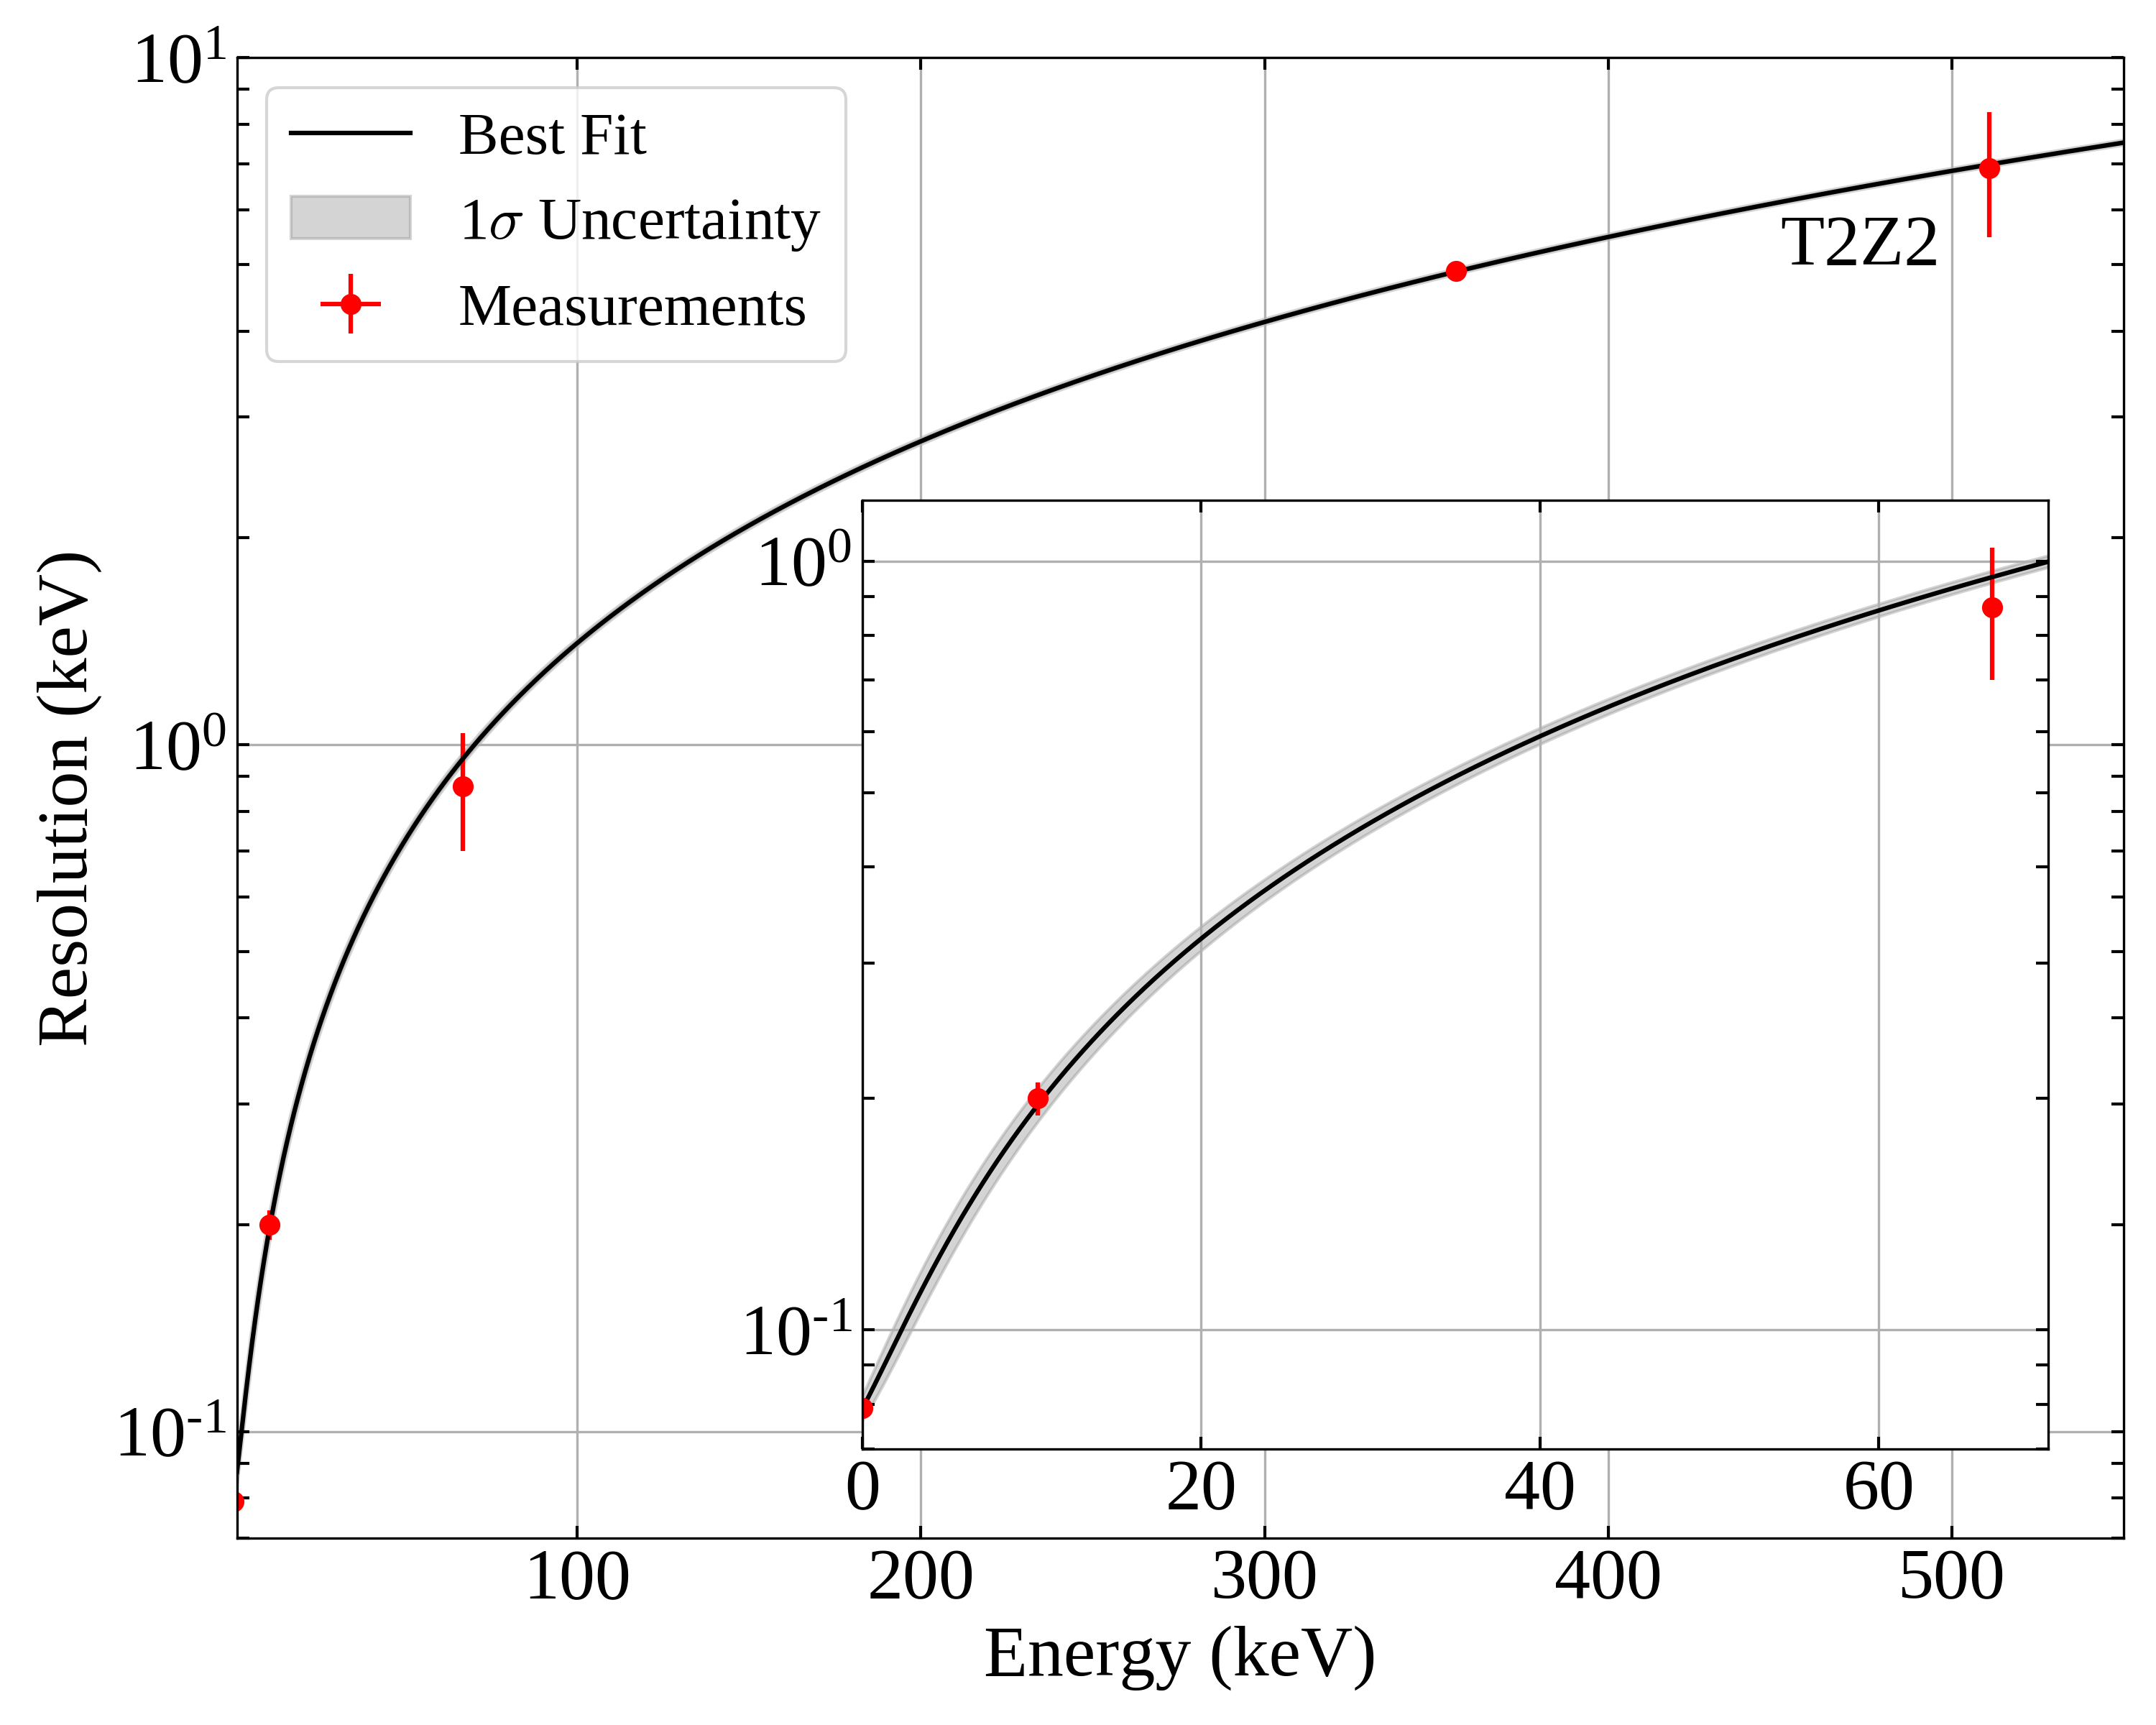
The fitted resolution model, for detector T2Z2 used in the iZIP analysis. The best fit curve (black line) and 1-sigma uncertainty band (grey) are shown with the measured peak widths (red points) to which the model is fit. The inset plot shows the same data, zoomed in to the region between 0-70 keV.

Efficiency Curve
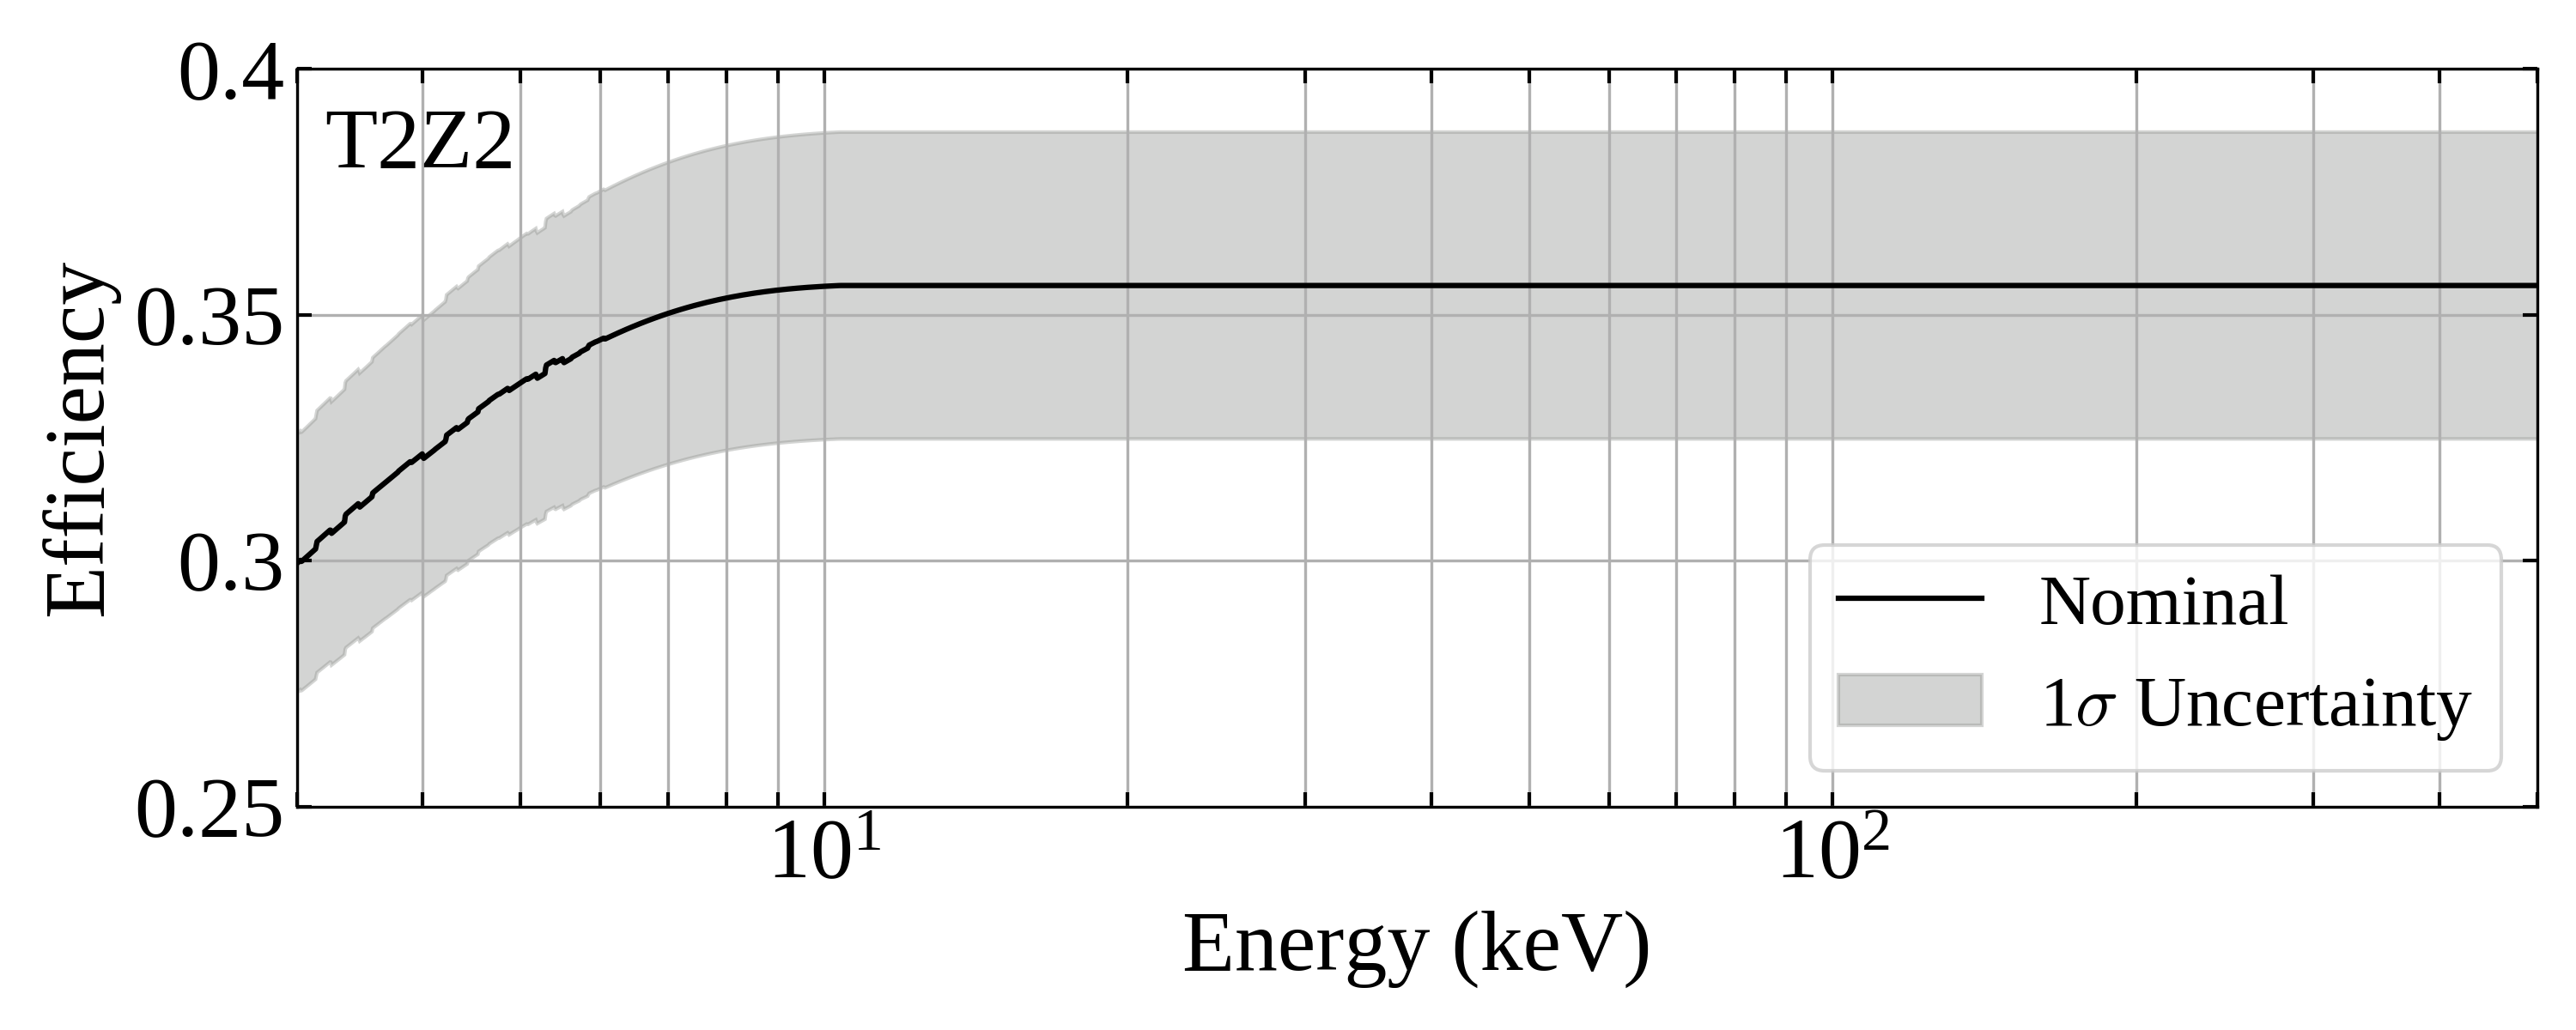
The efficiency for detector T2Z2, one of the detectors used in the iZIP analysis. The other iZIP detectors have similar efficiency curves to this, except for T1Z1, where the steep drop in efficiency occurs at a higher energy due to a higher trigger threshold. The best nominal value (black line) and 1-sigma uncertainty band (grey) are shown.

Rate Plot
Calculated 90 % upper limits on the rates for the combined iZIP data (dashed dark red), the combined CDMSlite data (dotted light red), and the combined data for SuperCDMS Soudan (black), for each ALP or DP mass tested. The shaded regions correspond to the systematic uncertainty bands on the rate. The large peaks near 1 keV and 10 keV are from the K and L shell electron capture of 71Ge.

Exclusion Limit
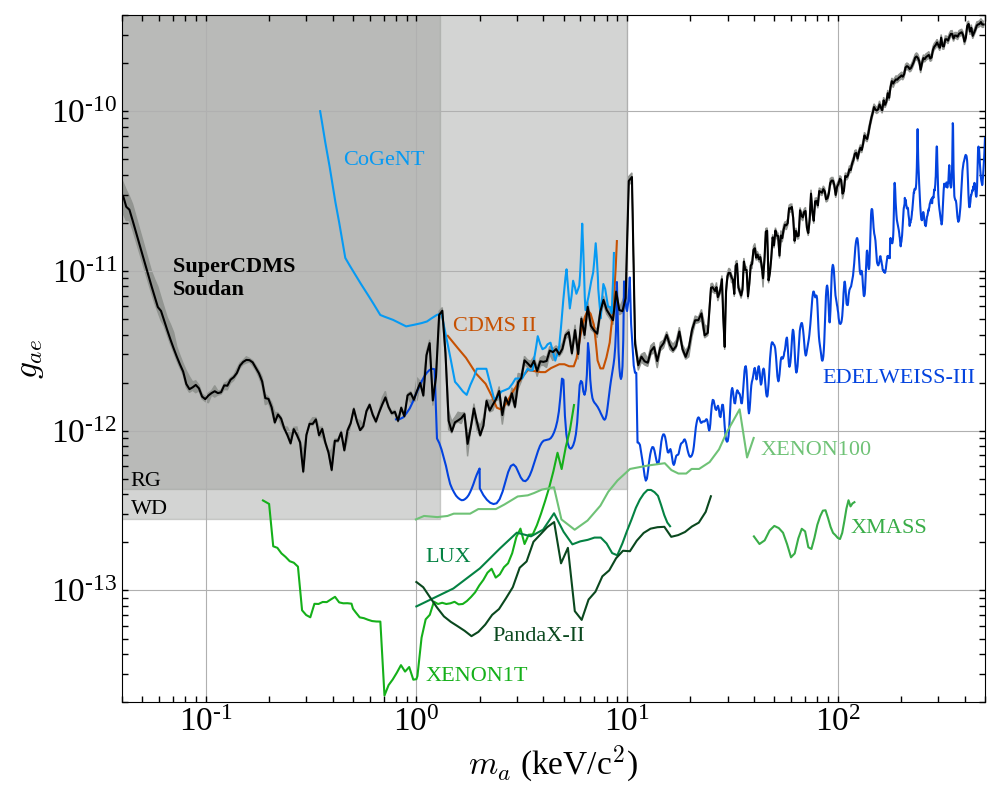
SuperCDMS Soudan upper limit (solid black) on the axioelectric coupling, with uncertainty band (shaded grey). Also shown are limits set on the axioelectric coupling by other direct-detection experiments including: CDMS II, CoGeNT, EDELWEISS-III, LUX, PandaX-II, XENON100, and XMASS. The shaded regions shows the constraint set by the cooling of red giant stars (RG) and white dwarfs (WD). See paper for references.

Exclusion Limit
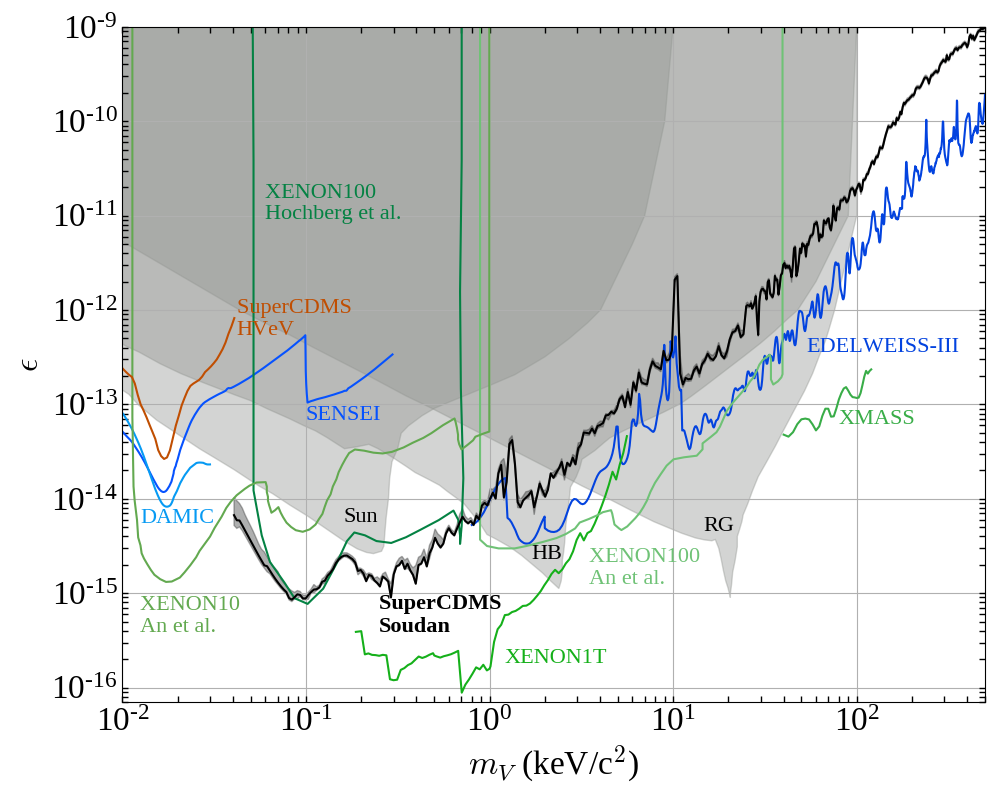
SuperCDMS Soudan upper limit (solid black) on the dark photon's kinetic mixing, with uncertainty band (shaded grey). Also shown are limits on the kinetic mixing parameter set by other direct-detection experiments including: DAMIC, EDELWEISS-III, SENSEI, SuperCDMS HVeV, XMASS, XENON10, and XENON100 (An et al., and Hochberg et al.). The shaded regions show various limits set from anomalous energy loss mechanisms in the Sun, horizontal branch stars (HB), and red giants (RG). See paper for references.