More HVeVR2
HVeV Run 2
Results
Topic
Last Updated
Comments/Download
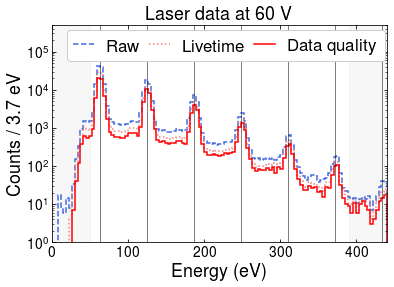
Data
March 27st, 2020
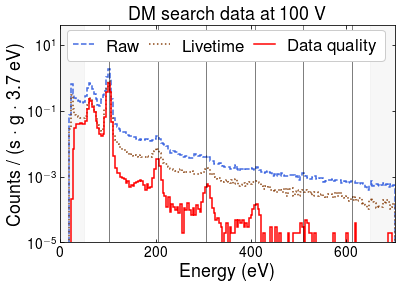
Data
March 27st, 2020
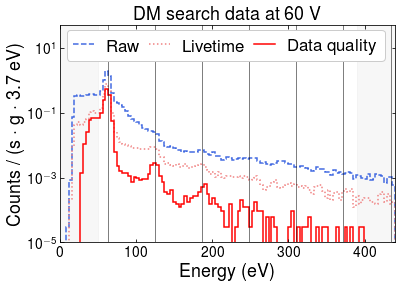
Data
March 27st, 2020
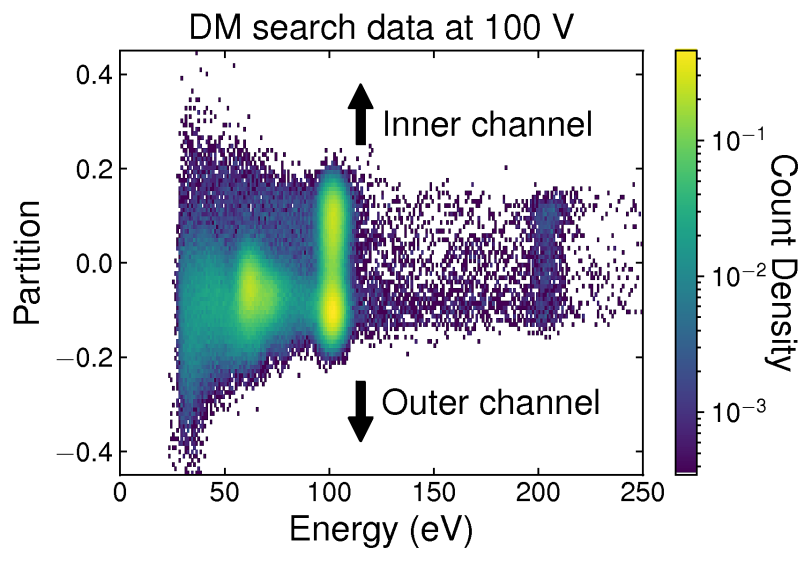
Data
February 21st, 2020
Limits
February 21st, 2020
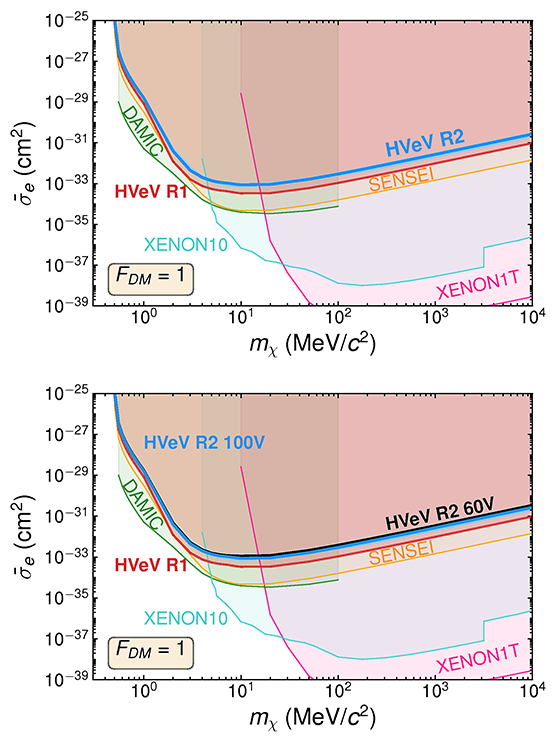
Dark matter electron-recoil limit with FDM=1 for the 100 V data
Dark matter electron-recoil FDM=1 Poisson limits with the 90% unblinded 100 V (blue) and 60 V (black) data with Fano factor. The uncertainty band represents the minimum and maximum values from the different assumptions of Fano factor in the ionization model (F = 1e-4, 0.3), as well as from the systematic uncertainties propagated in the limit calculation. The references for this plot can be found at the bottom of this page.
Limits
February 21st, 2020
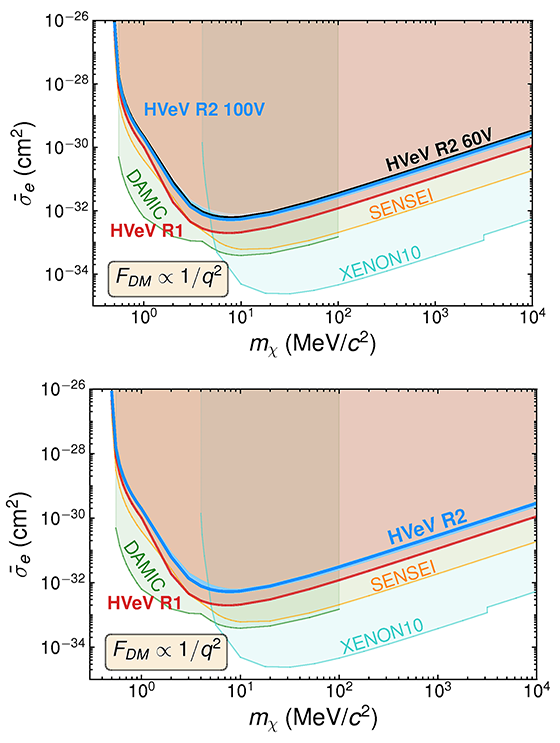
Dark matter electron-recoil limit with FDM ∝ 1/q2 for the 100 V data
Dark matter electron-recoil FDM ∝ 1/q2 Poisson limits with the 90% unblinded 100 V (blue) and 60 V (black) data with Fano factor. The uncertainty band represents the minimum and maximum values from the different assumptions of Fano factor in the ionization model (F = 1e-4, 0.3), as well as from the systematic uncertainties propagated in the limit calculation. The references for this plot can be found at the bottom of this page.
Limits
February 21st, 2020
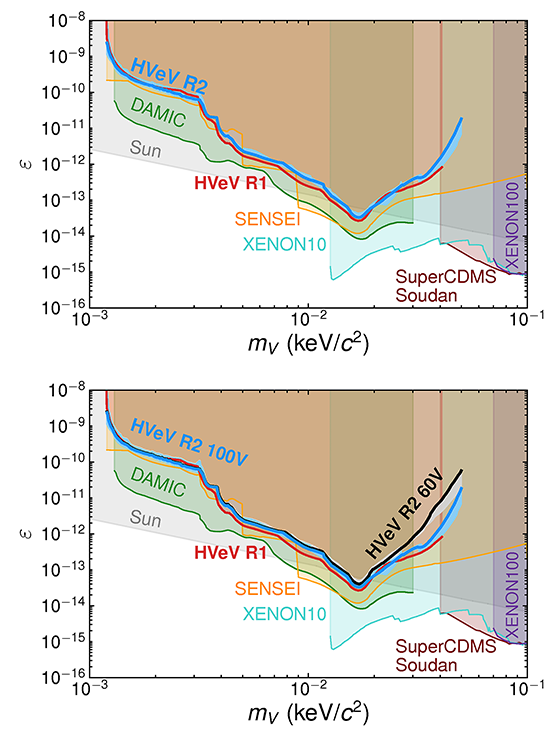
Dark matter dark photon absorption limit for the 100 V data
Dark photon absorption Poisson limits with the 90% unblinded 100 V (blue) and 60 V (black) data with Fano factor. The uncertainty band represents the minimum and maximum values from the different assumptions of Fano factor in the ionization model (F = 1e-4, 0.3), as well as from the systematic uncertainties propagated in the limit calculation. The divergence of the 60V and 100V limit at high mass is because the 6th eh peak for the 60 V is out of the region of interest, and so limits are only calculated with the 5th peak. The references for this plot can be found at the bottom of this page.
Limits
February 21st, 2020
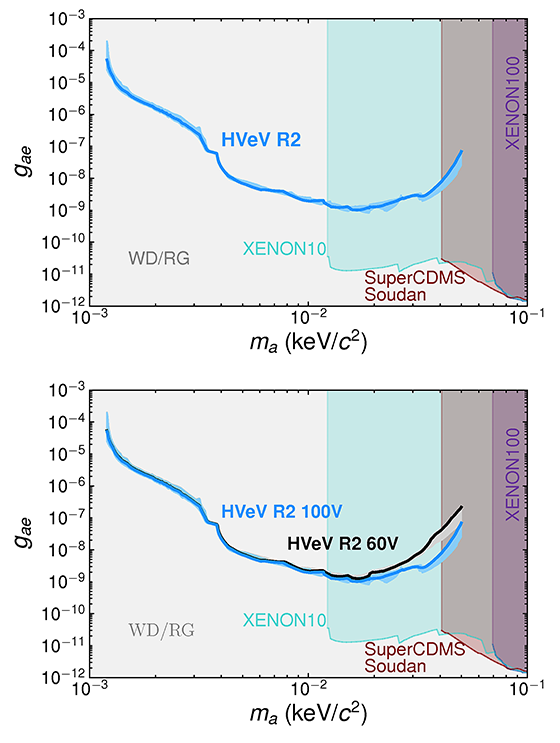
Dark matter axion-like particle limit for the 100 V data
Axion-like particle Poisson limits with the 90% unblinded 100 V (blue) and 60 V (black) data with Fano factor. The uncertainty band represents the minimum and maximum values from the different assumptions of Fano factor in the ionization model (F = 1e-4, 0.3), as well as from the systematic uncertainties propagated in the limit calculation. The divergence of the 60V and 100V limit at high mass is because the 6th eh peak for the 60 V is out of the region of interest, and so limits are only calculated with the 5th peak. The references for this plot can be found at the bottom of this page.
Limits
February 21st, 2020
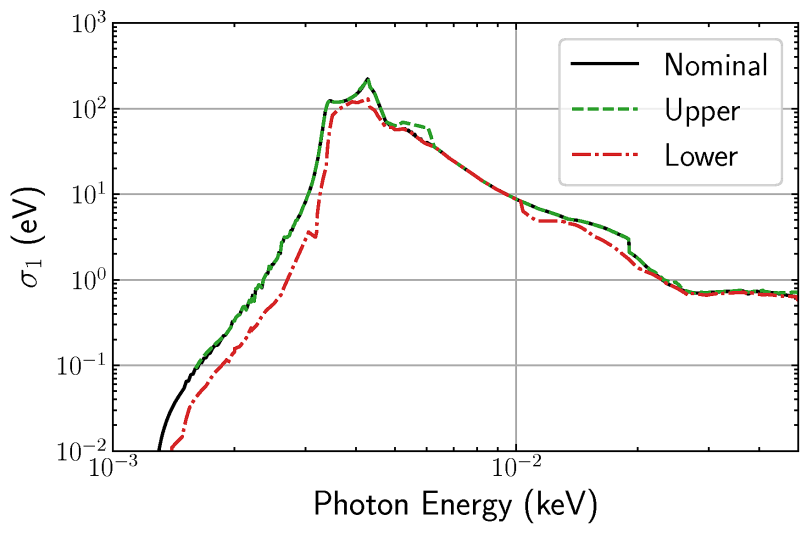
Absorption cross section
Real part of the complex conductivity, s1, as a function of photon energy for Si. The nominal curve follows the method used in Ref. [Y. Hochberg et al. Phys. Rev. D, 95:023013, 2017]. The upper and lower curves were determined using data from an extensive literature search, and applying analytic temperature reductions to estimate the photoelectric absorption cross section at the operating temperature of the detector. The references for this plot can be found at the bottom of this page.
Modeling
February 21st, 2020

Modeling
February 21st, 2020
Modeling
February 21st, 2020
Data
November 30th, 2020
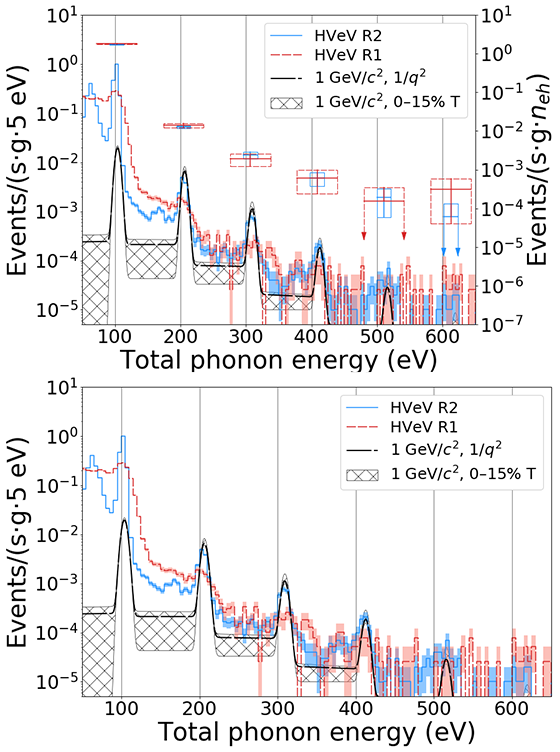
Comparison between the HVeV Run 1 data and the HVeV Run 2 data.
This plot shows the comparison between the two spectra acquired during HVeV Run 1 and Run 2. The two histograms have the same binning to present the different structures. An additional point is added on top of each electron-hole pair in order to highlight the event rate contained in a 3 σ window around the peak (corresponding to the counts in the peak). Each point has a 3 σ uncertainty on the number of counts. The black curve represents the electron-recoil dark matter model with FDM ∝ 1/q2 with a mass of 1 GeV/c2 for an impact ionization of 2 % and for a trapping of 11 %. The uncertainty considers a trapping varing in the range 0 - 15 %.
